📊 Weekly Technical Overview
Current Price: ₹3,004.80 (NSE)
Weekly Performance: +3.57%
Year-to-Date Performance: −26.69%
52-Week High: ₹4,592.25 (Aug 30, 2024)
52-Week Low: ₹2,888.40
🔍 Key Technical Indicators
Moving Averages:
5-Day MA: ₹3,018.94 (Sell)
50-Day MA: ₹2,980.76 (Buy)
200-Day MA: ₹3,046.08 (Sell)
Relative Strength Index (RSI): Currently at 40, indicating a neutral stance.
MACD: Bearish crossover observed, suggesting downward momentum.
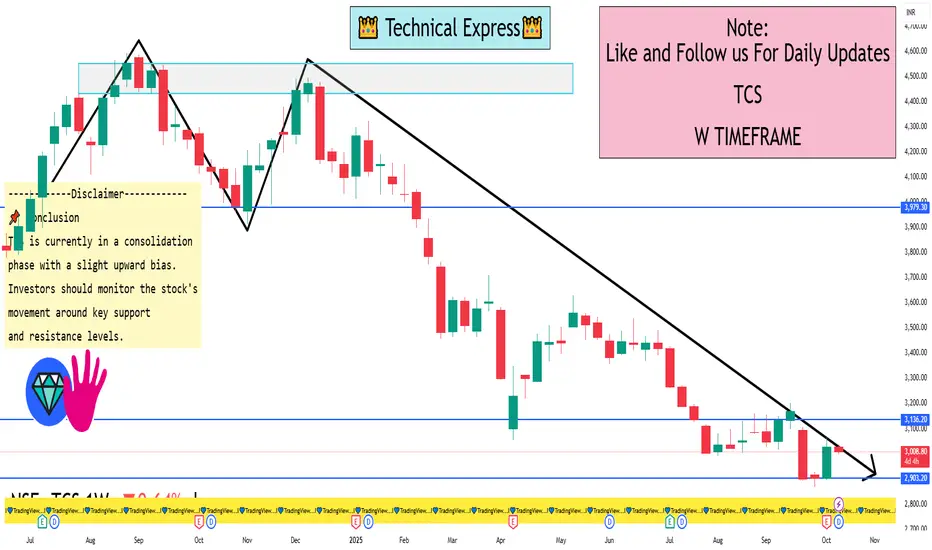
Support Levels: ₹2,888.40
Resistance Levels: ₹3,176.70
📌 Conclusion
TCS is currently in a consolidation phase with a slight upward bias. Investors should monitor the stock's movement around key support and resistance levels. A break below ₹2,888.40 could signal further downside, while a rise above ₹3,176.70 may indicate a potential trend reversal.
Current Price: ₹3,004.80 (NSE)
Weekly Performance: +3.57%
Year-to-Date Performance: −26.69%
52-Week High: ₹4,592.25 (Aug 30, 2024)
52-Week Low: ₹2,888.40
🔍 Key Technical Indicators
Moving Averages:
5-Day MA: ₹3,018.94 (Sell)
50-Day MA: ₹2,980.76 (Buy)
200-Day MA: ₹3,046.08 (Sell)
Relative Strength Index (RSI): Currently at 40, indicating a neutral stance.
MACD: Bearish crossover observed, suggesting downward momentum.
Support Levels: ₹2,888.40
Resistance Levels: ₹3,176.70
📌 Conclusion
TCS is currently in a consolidation phase with a slight upward bias. Investors should monitor the stock's movement around key support and resistance levels. A break below ₹2,888.40 could signal further downside, while a rise above ₹3,176.70 may indicate a potential trend reversal.
I built a Buy & Sell Signal Indicator with 85% accuracy.
📈 Get access via DM or
WhatsApp: wa.link/d997q0
Contact - +91 76782 40962
| Email: techncialexpress@gmail.com
| Script Coder | Trader | Investor | From India
📈 Get access via DM or
WhatsApp: wa.link/d997q0
Contact - +91 76782 40962
| Email: techncialexpress@gmail.com
| Script Coder | Trader | Investor | From India
Bài đăng liên quan
Thông báo miễn trừ trách nhiệm
Thông tin và các ấn phẩm này không nhằm mục đích, và không cấu thành, lời khuyên hoặc khuyến nghị về tài chính, đầu tư, giao dịch hay các loại khác do TradingView cung cấp hoặc xác nhận. Đọc thêm tại Điều khoản Sử dụng.