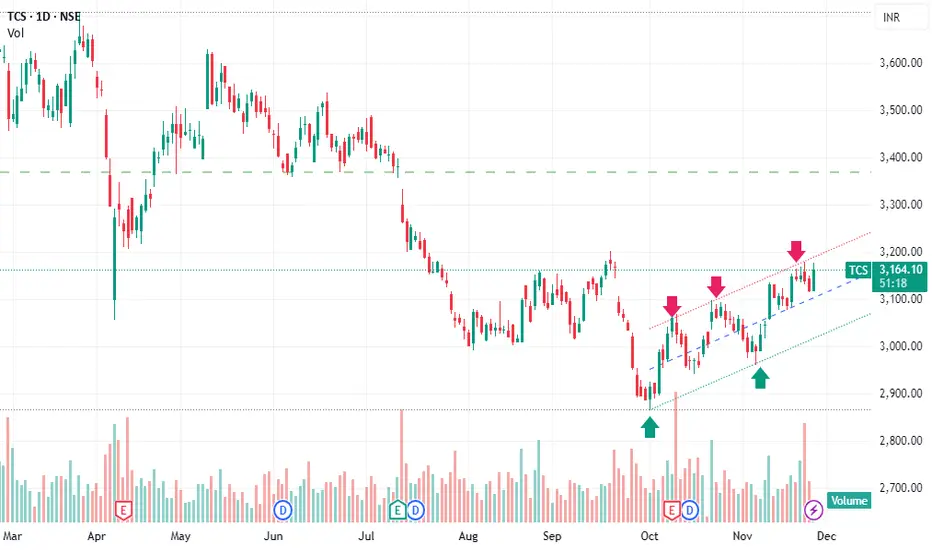
Tata Consultancy Services (TCS) on daily charts is currently trading within a well-defined upward sloping price channel, indicating a persistent bullish structure supported by higher highs and higher lows.
Trend Structure
The stock has been respecting both the rising support trendline (lower boundary) and the parallel rising resistance line (upper boundary).
Each pullback towards the lower end of the channel has attracted buying interest, reflecting strong demand at dips.
Support & Resistance within the Channel
Support Zone: The lower trendline of the channel continues to act as a dynamic support. As long as the price stays above this line, the bullish setup remains intact.
Resistance Zone: The upper boundary of the channel is acting as a profit-booking zone. Breakouts above this can accelerate momentum.
Trading View
Bullish Bias: Favourable as long as price remains inside or above the lower trendline.
Buy-on-Dips Strategy: Pullbacks to channel support provide low-risk accumulation opportunities.
Breakout Potential: A decisive close above the upper channel line may open room for a stronger upside extension.
Risk Level: A breakdown below the lower boundary would weaken the trend and invite corrective pressure.
Conclusion
TCS continues to maintain a robust medium-term uptrend within an upward sloping channel. The pattern signals trend strength, consistent institutional participation, and a favourable risk-reward setup on dips. Traders and investors may monitor pullback entries near support and watch for a potential breakout above the channel resistance.
Thông báo miễn trừ trách nhiệm
Thông tin và các ấn phẩm này không nhằm mục đích, và không cấu thành, lời khuyên hoặc khuyến nghị về tài chính, đầu tư, giao dịch hay các loại khác do TradingView cung cấp hoặc xác nhận. Đọc thêm tại Điều khoản Sử dụng.
Thông báo miễn trừ trách nhiệm
Thông tin và các ấn phẩm này không nhằm mục đích, và không cấu thành, lời khuyên hoặc khuyến nghị về tài chính, đầu tư, giao dịch hay các loại khác do TradingView cung cấp hoặc xác nhận. Đọc thêm tại Điều khoản Sử dụng.