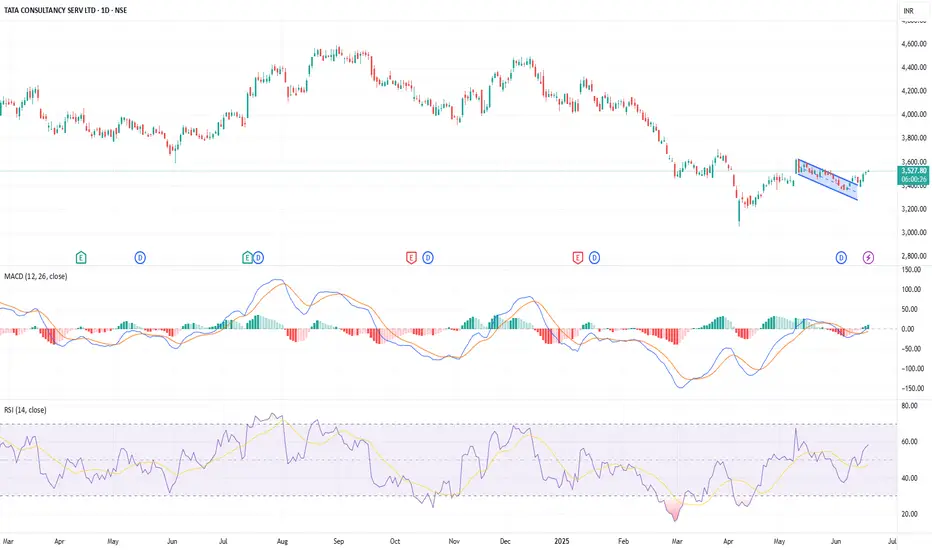
Breakout from a bullish falling wedge pattern and retesting the same breakout zone gives confidence of positive reversal probably. MACD crossover with rising histogram indicates strong momentum. RSI at 58.58, rising with room for further upside. Price sustaining above the wedge confirms breakout strength. Overall setup suggests a positive short-term trend continuation.
This is just for educational purpose and I am not giving any recommendation or target for TCS.
This is just for educational purpose and I am not giving any recommendation or target for TCS.
Bài đăng liên quan
Thông báo miễn trừ trách nhiệm
The information and publications are not meant to be, and do not constitute, financial, investment, trading, or other types of advice or recommendations supplied or endorsed by TradingView. Read more in the Terms of Use.
Bài đăng liên quan
Thông báo miễn trừ trách nhiệm
The information and publications are not meant to be, and do not constitute, financial, investment, trading, or other types of advice or recommendations supplied or endorsed by TradingView. Read more in the Terms of Use.