Weekly Chart- 
1. Pattern Analysis
TRF LTD currently showcases a powerful confluence of three distinct bullish patterns across varying timeframes, making the setup especially notable. On the monthly chart, we identify a Rounding Bottom pattern spanning an impressive 13 years. This rare and robust pattern has finally transitioned into the breakout phase, confirming a long-term structural reversal from its historic lows. The neckline breakout occurred above the ₹360 level, with the next major resistance seen around ₹467.
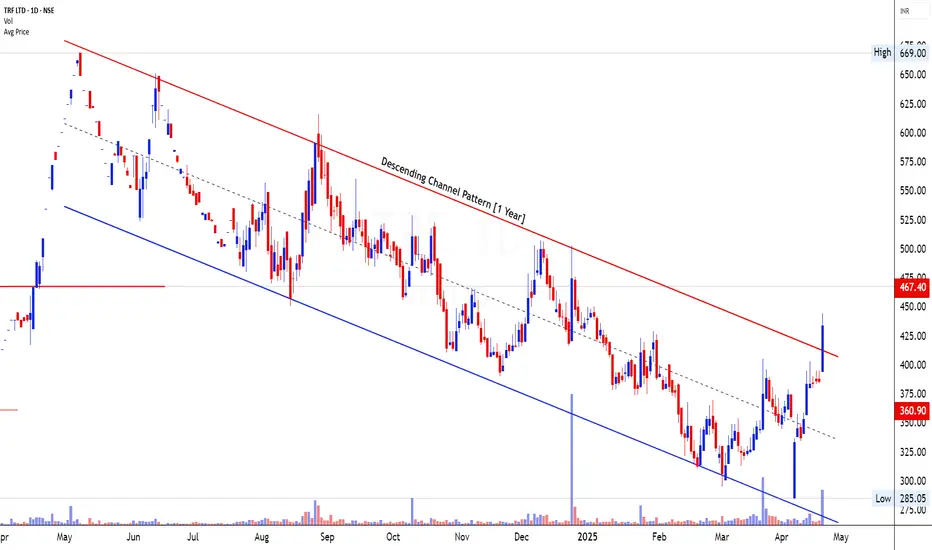
Simultaneously, the weekly chart illustrates a strong recovery from the ₹360 support zone, a level that has held significance for over a year. The price has now started reclaiming higher levels with renewed momentum. Adding to this setup, the daily chart reveals a Descending Channel breakout, a pattern that spanned nearly a year. Price has decisively broken above the upper trendline of the descending channel, completing a short-term reversal within a broader long-term bullish context.
Together, these patterns highlight a strong reversal narrative, where long-term and short-term structures are aligned, increasing the reliability of the bullish signal.
2. Volume Analysis
Volume behavior is a critical supporting indicator in this setup. On the monthly timeframe, we’ve observed volume expansion during the breakout phase of the 13-year Rounding Bottom. Such elevated volumes indicate strong accumulation by institutional players, likely building long-term positions.
The weekly volume remains significantly above average, particularly in the last two candles, as the stock pushed above the ₹360 level. This supports the idea that the bounce is not random but backed by genuine buying interest.
On the daily chart, the breakout from the Descending Channel was marked by a surge in volume, creating a classic volume-price breakout pattern. This alignment of increasing volume with breakout points across all timeframes signals strong conviction behind the price move and validates the breakout quality.
3. Candlestick / Price Analysis
The price action on the daily chart has turned highly constructive. A sequence of strong bullish candles with wide ranges and strong closes confirms intraday demand dominance. The candle on the breakout day from the channel is particularly notable, closing near the day’s high with a wide range, forming a bullish marubozu pattern—often a signature of trend change.
The weekly chart reflects a clean reversal with the current candle engulfing previous minor resistances and forming a powerful bullish candle. The shift in sentiment is visible through successive higher lows and higher highs over the past few weeks.
On the monthly chart, the structure confirms the end of a multi-year base-building phase, with the current candle showing strong follow-through after a confirmed breakout. The price is well above the 10-month average and is now targeting prior highs with limited resistance in the near zone.
4. Validation of Signal
All three timeframes – monthly, weekly, and daily – are currently aligned in favor of a bullish reversal. The monthly rounding bottom breakout is validated with both volume expansion and price follow-through. The weekly chart confirms a successful retest of the ₹360 level, and the daily breakout from the descending channel adds momentum and timing for potential swing and positional entries.
Moreover, price is now hovering close to the ₹433 level, just shy of the major monthly resistance at ₹467. A sustained move above ₹467 would likely open doors to higher targets based on the full projection of the rounding bottom base.
Thus, we have a multi-timeframe breakout confirmation that strengthens the bullish signal and reduces the probability of a failed breakout.
5. Tradable Points Determination
Entry Point Determination
Traders may look for an entry around the current price near ₹430–₹435. Given the recent breakout and strong bullish structure, any small dip or consolidation near this level would offer a low-risk entry setup. For those waiting for confirmation, a breakout above ₹467 will act as a further entry trigger.
Target Point Determination
Based on the rounding bottom base width and prior high projections:
Target 1: ₹525 – a near-term swing target based on channel height from the daily pattern.
Target 2: ₹600 – medium-term target from the breakout of the descending channel and historical supply zones.
Target 3: ₹700+ – long-term target derived from the height of the Rounding Bottom base, projected from the ₹360 neckline breakout level.
Stop Loss Placement and Trailing SL Follow-up
An initial stop loss can be placed below ₹385, just under the breakout zone and recent swing low. For positional trades based on the monthly structure, a wider stop near ₹360 may be considered to accommodate volatility.
Once price sustains above ₹467, traders should consider trailing the stop loss higher—perhaps to ₹420 initially and then to ₹467 as price nears ₹525. This trailing approach helps secure profits while staying in the trend.Mo
1. Pattern Analysis
TRF LTD currently showcases a powerful confluence of three distinct bullish patterns across varying timeframes, making the setup especially notable. On the monthly chart, we identify a Rounding Bottom pattern spanning an impressive 13 years. This rare and robust pattern has finally transitioned into the breakout phase, confirming a long-term structural reversal from its historic lows. The neckline breakout occurred above the ₹360 level, with the next major resistance seen around ₹467.
Simultaneously, the weekly chart illustrates a strong recovery from the ₹360 support zone, a level that has held significance for over a year. The price has now started reclaiming higher levels with renewed momentum. Adding to this setup, the daily chart reveals a Descending Channel breakout, a pattern that spanned nearly a year. Price has decisively broken above the upper trendline of the descending channel, completing a short-term reversal within a broader long-term bullish context.
Together, these patterns highlight a strong reversal narrative, where long-term and short-term structures are aligned, increasing the reliability of the bullish signal.
2. Volume Analysis
Volume behavior is a critical supporting indicator in this setup. On the monthly timeframe, we’ve observed volume expansion during the breakout phase of the 13-year Rounding Bottom. Such elevated volumes indicate strong accumulation by institutional players, likely building long-term positions.
The weekly volume remains significantly above average, particularly in the last two candles, as the stock pushed above the ₹360 level. This supports the idea that the bounce is not random but backed by genuine buying interest.
On the daily chart, the breakout from the Descending Channel was marked by a surge in volume, creating a classic volume-price breakout pattern. This alignment of increasing volume with breakout points across all timeframes signals strong conviction behind the price move and validates the breakout quality.
3. Candlestick / Price Analysis
The price action on the daily chart has turned highly constructive. A sequence of strong bullish candles with wide ranges and strong closes confirms intraday demand dominance. The candle on the breakout day from the channel is particularly notable, closing near the day’s high with a wide range, forming a bullish marubozu pattern—often a signature of trend change.
The weekly chart reflects a clean reversal with the current candle engulfing previous minor resistances and forming a powerful bullish candle. The shift in sentiment is visible through successive higher lows and higher highs over the past few weeks.
On the monthly chart, the structure confirms the end of a multi-year base-building phase, with the current candle showing strong follow-through after a confirmed breakout. The price is well above the 10-month average and is now targeting prior highs with limited resistance in the near zone.
4. Validation of Signal
All three timeframes – monthly, weekly, and daily – are currently aligned in favor of a bullish reversal. The monthly rounding bottom breakout is validated with both volume expansion and price follow-through. The weekly chart confirms a successful retest of the ₹360 level, and the daily breakout from the descending channel adds momentum and timing for potential swing and positional entries.
Moreover, price is now hovering close to the ₹433 level, just shy of the major monthly resistance at ₹467. A sustained move above ₹467 would likely open doors to higher targets based on the full projection of the rounding bottom base.
Thus, we have a multi-timeframe breakout confirmation that strengthens the bullish signal and reduces the probability of a failed breakout.
5. Tradable Points Determination
Entry Point Determination
Traders may look for an entry around the current price near ₹430–₹435. Given the recent breakout and strong bullish structure, any small dip or consolidation near this level would offer a low-risk entry setup. For those waiting for confirmation, a breakout above ₹467 will act as a further entry trigger.
Target Point Determination
Based on the rounding bottom base width and prior high projections:
Target 1: ₹525 – a near-term swing target based on channel height from the daily pattern.
Target 2: ₹600 – medium-term target from the breakout of the descending channel and historical supply zones.
Target 3: ₹700+ – long-term target derived from the height of the Rounding Bottom base, projected from the ₹360 neckline breakout level.
Stop Loss Placement and Trailing SL Follow-up
An initial stop loss can be placed below ₹385, just under the breakout zone and recent swing low. For positional trades based on the monthly structure, a wider stop near ₹360 may be considered to accommodate volatility.
Once price sustains above ₹467, traders should consider trailing the stop loss higher—perhaps to ₹420 initially and then to ₹467 as price nears ₹525. This trailing approach helps secure profits while staying in the trend.Mo
Learn Today for Better Tomorrow
Thông báo miễn trừ trách nhiệm
Thông tin và ấn phẩm không có nghĩa là và không cấu thành, tài chính, đầu tư, kinh doanh, hoặc các loại lời khuyên hoặc khuyến nghị khác được cung cấp hoặc xác nhận bởi TradingView. Đọc thêm trong Điều khoản sử dụng.
Learn Today for Better Tomorrow
Thông báo miễn trừ trách nhiệm
Thông tin và ấn phẩm không có nghĩa là và không cấu thành, tài chính, đầu tư, kinh doanh, hoặc các loại lời khuyên hoặc khuyến nghị khác được cung cấp hoặc xác nhận bởi TradingView. Đọc thêm trong Điều khoản sử dụng.