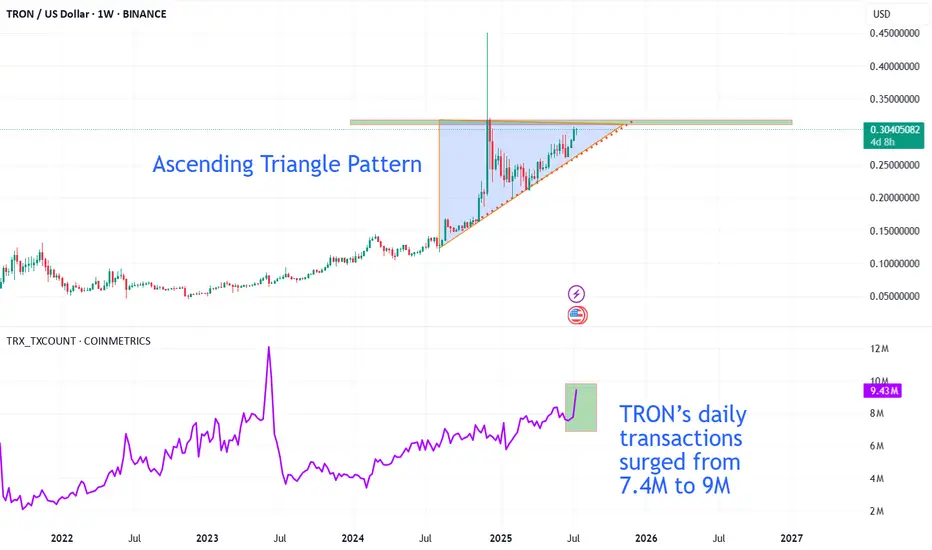
The TRX/USDT weekly chart is showing TRON testing a major resistance zone near $0.32, while forming a classic ascending triangle pattern just below this level. This bullish structure typically signals increasing momentum from buyers and raises the potential for a breakout above resistance.
What makes the bullish case even more compelling is the strong on-chain activity. According to Cryptoonchain (using CryptoQuant data), daily transactions on the TRON network have surged above 9 million, with the 100-day moving average also hovering close to its all-time highs. This significant growth reflects not only rising user engagement but also a sustained demand for network utility. Historically, sharp increases in on-chain activity have often fueled major price moves, especially when combined with clear bullish technical charts.
If TRX can achieve a decisive breakout above the $0.32 resistance with meaningful trading volume, a new bullish phase could be triggered in the medium term. However, traders should be cautious about the potential for fake-outs or temporary pullbacks after the first breakout.
Summary:
A combination of the ascending triangle formation and record-high on-chain activity (as reported by Cryptoonchain with CryptoQuant data) noticeably increases the odds of a successful breakout for TRON. Still, true confirmation relies on a clear, sustained close above the $0.32 level.
Thông báo miễn trừ trách nhiệm
Thông tin và các ấn phẩm này không nhằm mục đích, và không cấu thành, lời khuyên hoặc khuyến nghị về tài chính, đầu tư, giao dịch hay các loại khác do TradingView cung cấp hoặc xác nhận. Đọc thêm tại Điều khoản Sử dụng.
Thông báo miễn trừ trách nhiệm
Thông tin và các ấn phẩm này không nhằm mục đích, và không cấu thành, lời khuyên hoặc khuyến nghị về tài chính, đầu tư, giao dịch hay các loại khác do TradingView cung cấp hoặc xác nhận. Đọc thêm tại Điều khoản Sử dụng.