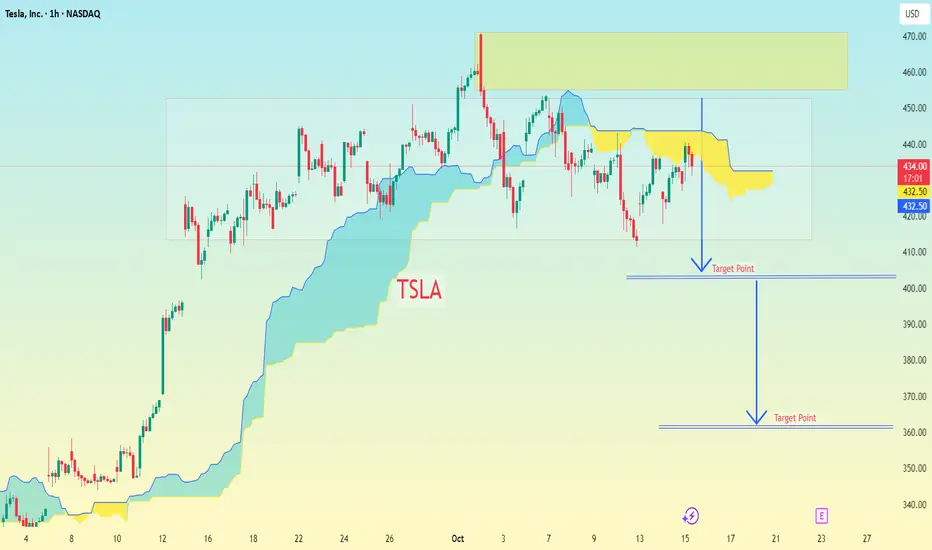
TSLA with Ichimoku Cloud and projected target points drawn below the current price.
Let’s break it down:
Current price on chart: around $434
Yellow zone (resistance): roughly $445–$465
First target line drawn: around $405–$410
Second (lower) target line drawn: around $365–$370
📊 Interpretation (based on my chart):
Target Level Approx. Price Meaning
1st Target $405–$410 Short-term support / take-profit zone
2nd Target $365–$370 Deeper correction / extended short target
⚠ Note:
These targets are based on my chart’s visual annotations, likely assuming price breaks below the Ichimoku cloud and moves toward lower support levels. This aligns with a bearish setup.
👉 Risk Management Tip:
If entering short, a stop loss just above the resistance zone ($450–$455) may be considered.
If entering long, these same levels can act as profit-taking or add-on zones.
Giao dịch đang hoạt động
trade active 📲 Join telegram channel free .
t.me/addlist/dg3uSwzkMSplNjFk
Forex, Gold & Crypto Signals with detailed analysis & get consistent results.
t.me/+PNWQFM8CwnswYTc0
Gold Signal's with proper TP & SL for high profit opportunities.
t.me/addlist/dg3uSwzkMSplNjFk
Forex, Gold & Crypto Signals with detailed analysis & get consistent results.
t.me/+PNWQFM8CwnswYTc0
Gold Signal's with proper TP & SL for high profit opportunities.
Bài đăng liên quan
Thông báo miễn trừ trách nhiệm
Thông tin và các ấn phẩm này không nhằm mục đích, và không cấu thành, lời khuyên hoặc khuyến nghị về tài chính, đầu tư, giao dịch hay các loại khác do TradingView cung cấp hoặc xác nhận. Đọc thêm tại Điều khoản Sử dụng.
📲 Join telegram channel free .
t.me/addlist/dg3uSwzkMSplNjFk
Forex, Gold & Crypto Signals with detailed analysis & get consistent results.
t.me/+PNWQFM8CwnswYTc0
Gold Signal's with proper TP & SL for high profit opportunities.
t.me/addlist/dg3uSwzkMSplNjFk
Forex, Gold & Crypto Signals with detailed analysis & get consistent results.
t.me/+PNWQFM8CwnswYTc0
Gold Signal's with proper TP & SL for high profit opportunities.
Bài đăng liên quan
Thông báo miễn trừ trách nhiệm
Thông tin và các ấn phẩm này không nhằm mục đích, và không cấu thành, lời khuyên hoặc khuyến nghị về tài chính, đầu tư, giao dịch hay các loại khác do TradingView cung cấp hoặc xác nhận. Đọc thêm tại Điều khoản Sử dụng.