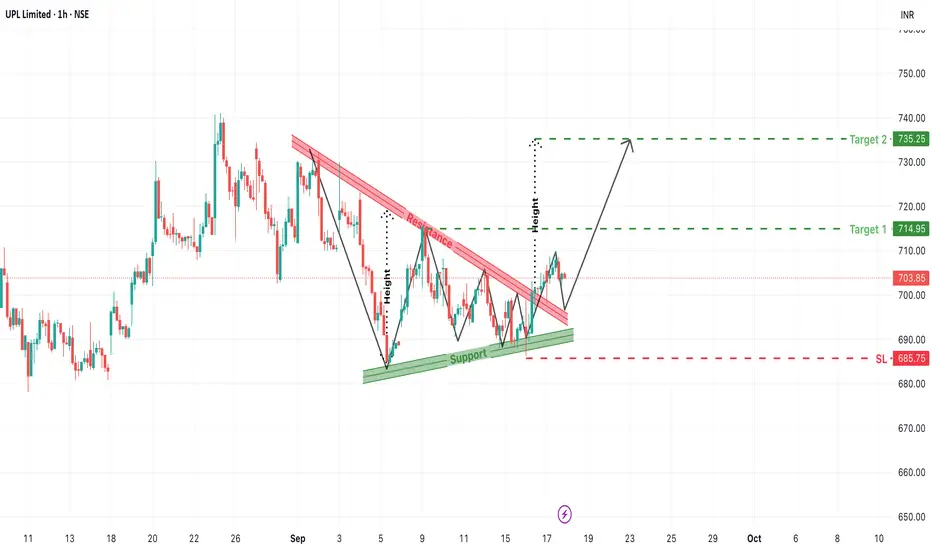
The chart for UPL Limited (1-Hour, NSE) presents a promising bullish breakout scenario, emerging from a well-defined falling wedge (descending channel). Traders and investors watching for breakout opportunities will want to monitor this move closely as the price breaks above resistance with potential to test higher levels.
1. Chart Pattern Formation: Falling Wedge with Bullish Implication
Over the past several trading sessions, UPL consolidated inside a downward sloping wedge pattern characterized by:
- Lower highs and lower lows, creating a narrowing channel.
- The support trendline consistently held the price near 685–690 levels.
- The resistance zone, marked with a red trendline, was tested multiple times before finally breaking out.
- This kind of pattern often precedes a trend reversal or continuation to the upside, especially when it forms after a prior bullish move.
2. Breakout Confirmation: Clean Move Above Resistance
- Price has broken out of the descending resistance, closing above ₹703+.
- This breakout came with a retest of the support and is now showing signs of resuming upward momentum.
- The price structure now signals the end of the downtrend inside the wedge and potential bullish continuation.
3. Target Projections Using Pattern Height
The measured height of the wedge pattern provides us with two price targets:
- Target 1: ₹714.95
The first logical resistance and Fibonacci extension zone.
- Target 2: ₹735.25
Based on full height projection of the wedge breakout.
These targets are calculated from the breakout level and are aligned with historical price action levels.
4. Stop Loss and Risk Management
- Suggested Stop Loss (SL): ₹685.75
Just below the support zone and wedge structure to avoid false breakouts.
- Entry Zone:
Around current levels of ₹703–704 or on dips near ₹700–701 if retest occurs.
- Risk-Reward Ratio:
Around 1:2.5 for T2, offering good upside with controlled risk.
5. Key Technical Takeaways
- Pattern: Falling Wedge (Bullish Reversal/Continuation)
- Breakout Zone: ₹703+
- Support Zone: ₹685–688
- Momentum Bias: Bullish (as long as price holds above support)
- Risk Zone: Below ₹685
- Reward Zone: ₹715 to ₹735
Conclusion: UPL Gearing Up for a Short-Term Rally
UPL has triggered a classic technical breakout from a falling wedge, backed by a retest and bounce from support. As long as price sustains above ₹685, bulls may drive the stock toward the upper targets of ₹715 and ₹735. The chart offers a low-risk, high-reward setup ideal for short-term swing traders.
📈 Trade Smarter with TradZoo!
📣 Telegram: t.me/tradzooIndex
📣 Forex Telegram: t.me/tradzoofx
📲 Mobile App: tradzoo.com/download
📲 Forex App:tradzoo.com/forex/download
🔗 Website: bit.ly/tradzoopage
📣 Telegram: t.me/tradzooIndex
📣 Forex Telegram: t.me/tradzoofx
📲 Mobile App: tradzoo.com/download
📲 Forex App:tradzoo.com/forex/download
🔗 Website: bit.ly/tradzoopage
Thông báo miễn trừ trách nhiệm
Thông tin và ấn phẩm không có nghĩa là và không cấu thành, tài chính, đầu tư, kinh doanh, hoặc các loại lời khuyên hoặc khuyến nghị khác được cung cấp hoặc xác nhận bởi TradingView. Đọc thêm trong Điều khoản sử dụng.