📊 Technical Trend & Pattern
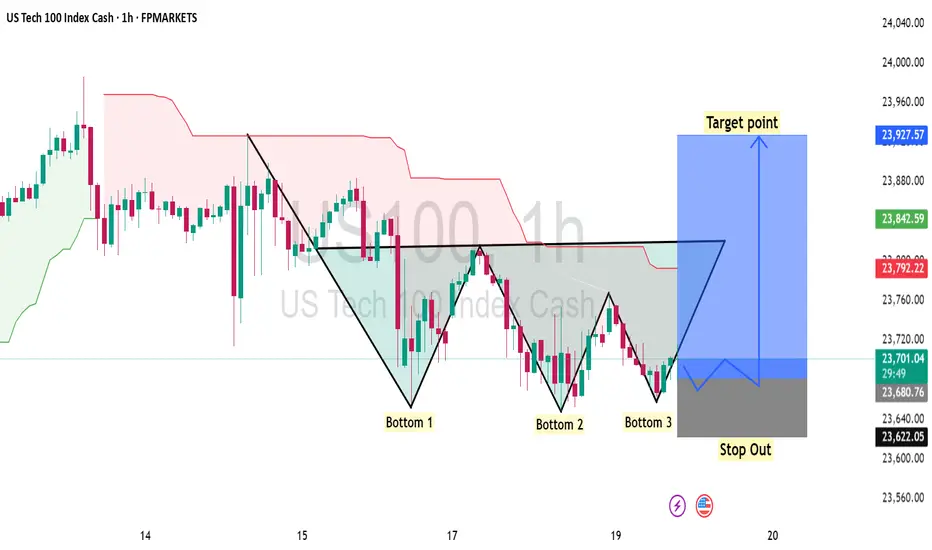
The index is forming a Triple Bottom pattern, signaling strong accumulation and potential bullish reversal from the 23,600 – 23,700 support zone. Price is currently testing neckline resistance around 23,800, and a breakout above this level could confirm upside momentum.
🔎 Key Levels
Support / Stop Out Zone: 23,600 – 23,650
Immediate Resistance: 23,800
Target Zone: 23,920 – 23,950
⚡ Fundamental Outlook
Market sentiment remains cautious but supported by optimism around U.S. tech earnings and macroeconomic stability. If positive catalysts continue, the index could extend gains toward the 23,927 target zone.
📈 Trading Idea
Bullish bias above 23,700 with confirmation on neckline breakout. A sustained move could open room toward 23,927+. Failure to hold support may trigger stop-outs below 23,600.
👍 Like this analysis & 🔔 Follow me for more trading updates and ideas.
💬 What’s your view? Drop your comments and ideas below!
Giao dịch đang hoạt động
buying trade active guys Thông báo miễn trừ trách nhiệm
Thông tin và ấn phẩm không có nghĩa là và không cấu thành, tài chính, đầu tư, kinh doanh, hoặc các loại lời khuyên hoặc khuyến nghị khác được cung cấp hoặc xác nhận bởi TradingView. Đọc thêm trong Điều khoản sử dụng.
Thông báo miễn trừ trách nhiệm
Thông tin và ấn phẩm không có nghĩa là và không cấu thành, tài chính, đầu tư, kinh doanh, hoặc các loại lời khuyên hoặc khuyến nghị khác được cung cấp hoặc xác nhận bởi TradingView. Đọc thêm trong Điều khoản sử dụng.