USDCAD 2-hour chart, here’s what can be observed and inferred technically:
🔍 Chart Analysis Summary:
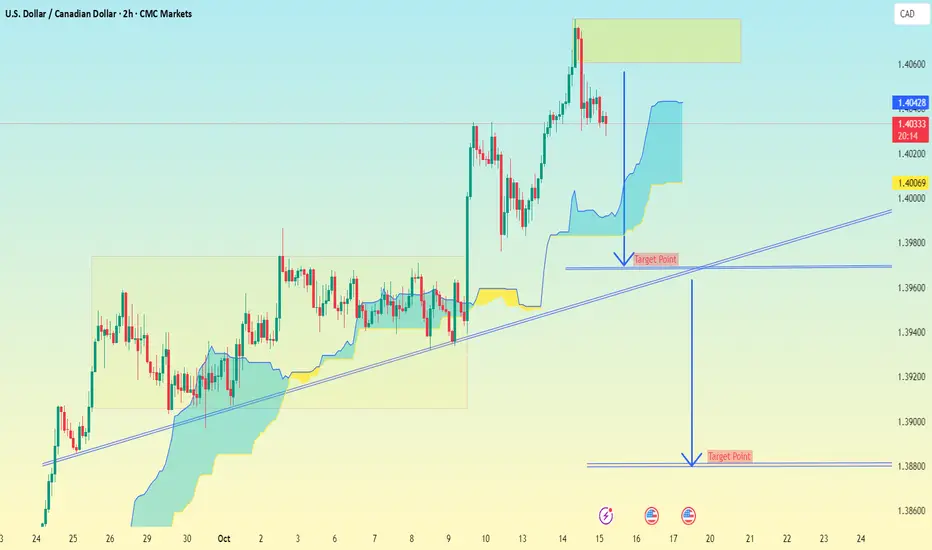
Pair: USD/CAD
Timeframe: 2H (2-hour)
Current price: ~1.4033
Trendline: Upward sloping (acting as dynamic support)
Recent action: Price broke out from consolidation, reached resistance near 1.4060–1.4080 zone, and started to pull back.
Cloud (Ichimoku): Currently price is above the Kumo cloud, but appears to be testing or potentially dipping into it.
---
🎯 Target Areas (based on your annotations and market structure)
1. Short-term target:
First Target Point: Around 1.4000–1.4009
This matches my chart annotation just above the ascending trendline.
Likely corresponds to minor support and a retest of the trendline area.
2. Extended / Swing Target:
Second Target Point: Around 1.3880–1.3890
This is marked as the lower "Target Point" on my chart.
It aligns with a deeper correction scenario if the trendline breaks cleanly and the bearish momentum extends.
That would fill the “measured move” drawn on my chart (projected from the previous range height).
---
⚠ Key Levels to Watch
Level Type Note
1.4080 Resistance Previous high / Supply zone
1.4000 Support / Target 1 Trendline + psychological round number
1.3880 Target 2 Full measured move projection
1.4060–1.4080 Sell Zone Potential retest area if price bounces
---
📉 Bias:
If the price breaks below 1.4000 (trendline support) and holds under the Kumo cloud, a move toward 1.3880 looks likely.
If it holds above 1.4000 and rebounds, the short-term correction could end there.
🔍 Chart Analysis Summary:
Pair: USD/CAD
Timeframe: 2H (2-hour)
Current price: ~1.4033
Trendline: Upward sloping (acting as dynamic support)
Recent action: Price broke out from consolidation, reached resistance near 1.4060–1.4080 zone, and started to pull back.
Cloud (Ichimoku): Currently price is above the Kumo cloud, but appears to be testing or potentially dipping into it.
---
🎯 Target Areas (based on your annotations and market structure)
1. Short-term target:
First Target Point: Around 1.4000–1.4009
This matches my chart annotation just above the ascending trendline.
Likely corresponds to minor support and a retest of the trendline area.
2. Extended / Swing Target:
Second Target Point: Around 1.3880–1.3890
This is marked as the lower "Target Point" on my chart.
It aligns with a deeper correction scenario if the trendline breaks cleanly and the bearish momentum extends.
That would fill the “measured move” drawn on my chart (projected from the previous range height).
---
⚠ Key Levels to Watch
Level Type Note
1.4080 Resistance Previous high / Supply zone
1.4000 Support / Target 1 Trendline + psychological round number
1.3880 Target 2 Full measured move projection
1.4060–1.4080 Sell Zone Potential retest area if price bounces
---
📉 Bias:
If the price breaks below 1.4000 (trendline support) and holds under the Kumo cloud, a move toward 1.3880 looks likely.
If it holds above 1.4000 and rebounds, the short-term correction could end there.
Giao dịch đang hoạt động
trade active📲 Join telegram channel free .
t.me/addlist/dg3uSwzkMSplNjFk
Forex, Gold & Crypto Signals with detailed analysis & get consistent results.
t.me/addlist/dg3uSwzkMSplNjFk
Gold Signal's with proper TP & SL for high profit opportunities.
t.me/addlist/dg3uSwzkMSplNjFk
Forex, Gold & Crypto Signals with detailed analysis & get consistent results.
t.me/addlist/dg3uSwzkMSplNjFk
Gold Signal's with proper TP & SL for high profit opportunities.
Bài đăng liên quan
Thông báo miễn trừ trách nhiệm
Thông tin và ấn phẩm không có nghĩa là và không cấu thành, tài chính, đầu tư, kinh doanh, hoặc các loại lời khuyên hoặc khuyến nghị khác được cung cấp hoặc xác nhận bởi TradingView. Đọc thêm trong Điều khoản sử dụng.
📲 Join telegram channel free .
t.me/addlist/dg3uSwzkMSplNjFk
Forex, Gold & Crypto Signals with detailed analysis & get consistent results.
t.me/addlist/dg3uSwzkMSplNjFk
Gold Signal's with proper TP & SL for high profit opportunities.
t.me/addlist/dg3uSwzkMSplNjFk
Forex, Gold & Crypto Signals with detailed analysis & get consistent results.
t.me/addlist/dg3uSwzkMSplNjFk
Gold Signal's with proper TP & SL for high profit opportunities.
Bài đăng liên quan
Thông báo miễn trừ trách nhiệm
Thông tin và ấn phẩm không có nghĩa là và không cấu thành, tài chính, đầu tư, kinh doanh, hoặc các loại lời khuyên hoặc khuyến nghị khác được cung cấp hoặc xác nhận bởi TradingView. Đọc thêm trong Điều khoản sử dụng.