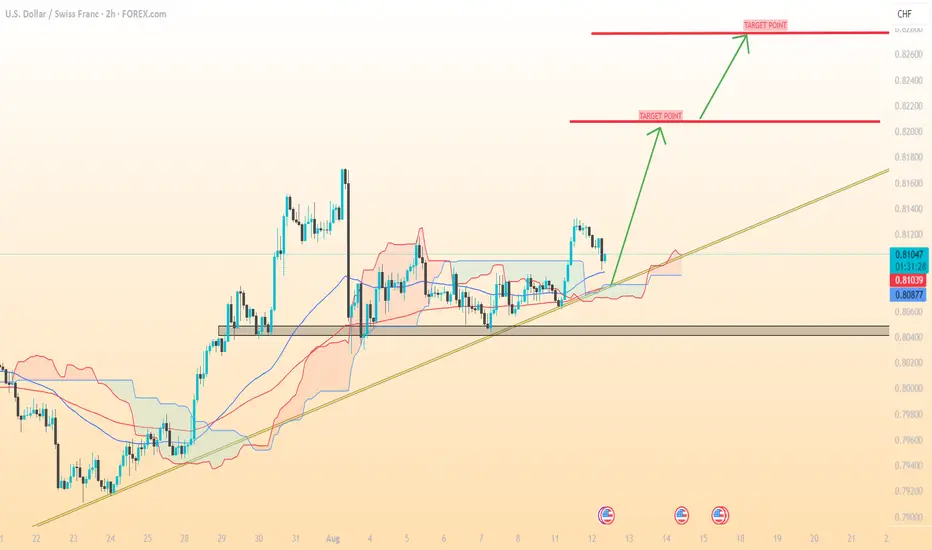
USD/CHF chart (2H),
---
🎯 Targets
First Target: 0.82050 – This is the nearest resistance from recent highs and a likely short-term take-profit zone.
Second Target: 0.82600 – Stronger resistance, aligning with previous rejection and psychological round number.
Extended Target (if breakout continues): 0.82550 – Based on the height of your last consolidation zone projected upward.
---
📊 Indicators in my Chart
1. Ichimoku Cloud
Price is currently above the Kumo (cloud) — bullish signal.
Conversion Line (Tenkan-sen) above Base Line (Kijun-sen) — confirms upside momentum.
Cloud ahead is thin and bullish-colored, suggesting easy upward movement if momentum holds.
2. Trendline Support
Strong ascending trendline from late July — price bouncing off this shows buyers are still in control.
3. Horizontal Support/Resistance
Marked red lines show previous swing highs — your logical target zones.
4. Volume Profile (on left)
Shows high trading activity zone between 0.8100 – 0.8130, meaning once price leaves this area, moves can be faster.
---
🛡 Suggested Stop Loss
Below 0.80800 (just under the cloud and trendline) to avoid false breakouts.
---
🎯 Targets
First Target: 0.82050 – This is the nearest resistance from recent highs and a likely short-term take-profit zone.
Second Target: 0.82600 – Stronger resistance, aligning with previous rejection and psychological round number.
Extended Target (if breakout continues): 0.82550 – Based on the height of your last consolidation zone projected upward.
---
📊 Indicators in my Chart
1. Ichimoku Cloud
Price is currently above the Kumo (cloud) — bullish signal.
Conversion Line (Tenkan-sen) above Base Line (Kijun-sen) — confirms upside momentum.
Cloud ahead is thin and bullish-colored, suggesting easy upward movement if momentum holds.
2. Trendline Support
Strong ascending trendline from late July — price bouncing off this shows buyers are still in control.
3. Horizontal Support/Resistance
Marked red lines show previous swing highs — your logical target zones.
4. Volume Profile (on left)
Shows high trading activity zone between 0.8100 – 0.8130, meaning once price leaves this area, moves can be faster.
---
🛡 Suggested Stop Loss
Below 0.80800 (just under the cloud and trendline) to avoid false breakouts.
Giao dịch đang hoạt động
trade active📲 Join telegram channel free ..
t.me/RSI_Trading_Point4
Forex, Gold & Crypto Signals with detailed analysis & get consistent results..
t.me/RSI_Trading_Point4
Gold Signal's with proper TP & SL for high profit opportunities..
t.me/RSI_Trading_Point4
Forex, Gold & Crypto Signals with detailed analysis & get consistent results..
t.me/RSI_Trading_Point4
Gold Signal's with proper TP & SL for high profit opportunities..
Bài đăng liên quan
Thông báo miễn trừ trách nhiệm
Thông tin và ấn phẩm không có nghĩa là và không cấu thành, tài chính, đầu tư, kinh doanh, hoặc các loại lời khuyên hoặc khuyến nghị khác được cung cấp hoặc xác nhận bởi TradingView. Đọc thêm trong Điều khoản sử dụng.
📲 Join telegram channel free ..
t.me/RSI_Trading_Point4
Forex, Gold & Crypto Signals with detailed analysis & get consistent results..
t.me/RSI_Trading_Point4
Gold Signal's with proper TP & SL for high profit opportunities..
t.me/RSI_Trading_Point4
Forex, Gold & Crypto Signals with detailed analysis & get consistent results..
t.me/RSI_Trading_Point4
Gold Signal's with proper TP & SL for high profit opportunities..
Bài đăng liên quan
Thông báo miễn trừ trách nhiệm
Thông tin và ấn phẩm không có nghĩa là và không cấu thành, tài chính, đầu tư, kinh doanh, hoặc các loại lời khuyên hoặc khuyến nghị khác được cung cấp hoặc xác nhận bởi TradingView. Đọc thêm trong Điều khoản sử dụng.