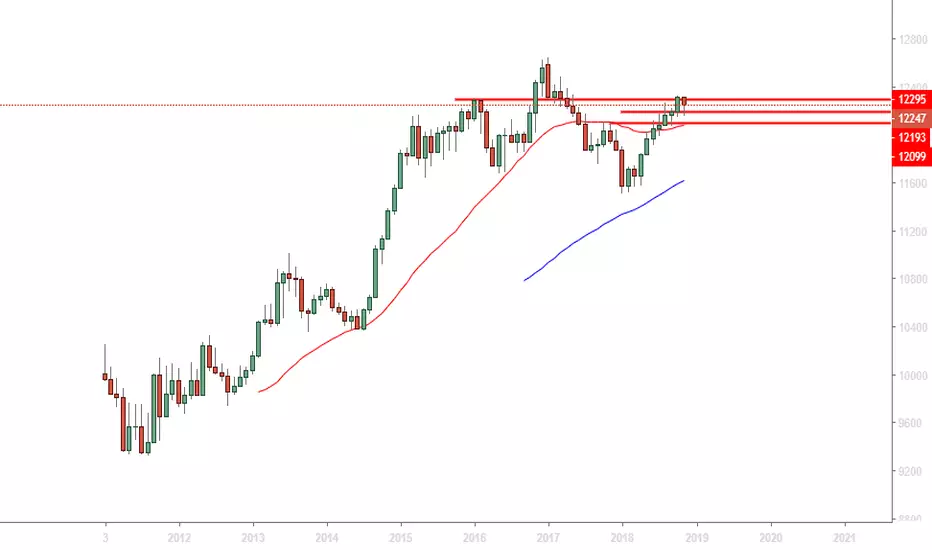
Monthly Chart

Bullish ongoing.
It is approaching the resistance at the left side.
It might be bullish, might be consolidating, might be building shoulder to go bearish.
Weekly Chart

Hitting resistance and weekly chart might be consolidating or going down to create lower high.
Daily Chart

The lower high has been created, and trend line is hit for a rebound to higher high.
At the same time, the bullish seems to be exhausting and side way or consolidation is expected for next week.
May try to enter for small position to test the market if want to.
4-Hour Chart

Observe if it breaks the left hand side high.
Hourly Chart

Hourly chart is moving higher high.
Decided to trade small position with tight stop loss, test the market.
Will add in more position if the direction is correct.
Bullish ongoing.
It is approaching the resistance at the left side.
It might be bullish, might be consolidating, might be building shoulder to go bearish.
Weekly Chart
Hitting resistance and weekly chart might be consolidating or going down to create lower high.
Daily Chart
The lower high has been created, and trend line is hit for a rebound to higher high.
At the same time, the bullish seems to be exhausting and side way or consolidation is expected for next week.
May try to enter for small position to test the market if want to.
4-Hour Chart
Observe if it breaks the left hand side high.
Hourly Chart
Hourly chart is moving higher high.
Decided to trade small position with tight stop loss, test the market.
Will add in more position if the direction is correct.
Thông báo miễn trừ trách nhiệm
Thông tin và ấn phẩm không có nghĩa là và không cấu thành, tài chính, đầu tư, kinh doanh, hoặc các loại lời khuyên hoặc khuyến nghị khác được cung cấp hoặc xác nhận bởi TradingView. Đọc thêm trong Điều khoản sử dụng.
Thông báo miễn trừ trách nhiệm
Thông tin và ấn phẩm không có nghĩa là và không cấu thành, tài chính, đầu tư, kinh doanh, hoặc các loại lời khuyên hoặc khuyến nghị khác được cung cấp hoặc xác nhận bởi TradingView. Đọc thêm trong Điều khoản sử dụng.