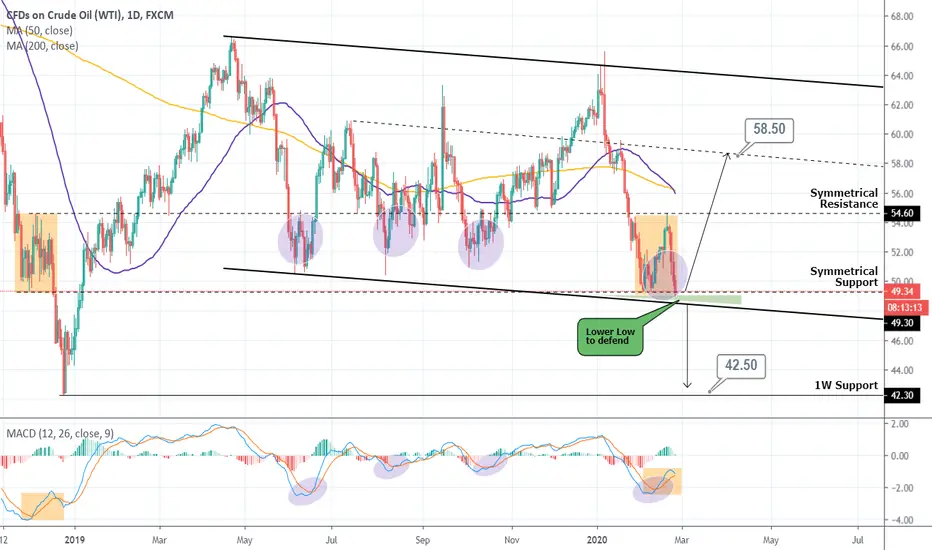
The pattern is a Channel Down since the April 2019 66.60 top. However with the price rejected on the 54.60 Resistance and pulling back to the 49 region the very bearish fractal of 21 Nov - 14 Dec 2018 comes to my mind. See how both then and now the price traded within the 54.60 Resistance and 49.30 Support.
As a result buyers must defend the Lower Low zone of the long term Channel Down (which I have displayed it with the green Triangle) if they want to avoid an aggressive break down to the 42.30 1W Support (24 December bottom).
On the other hand, every time the Channel Down made a Lower Low, the price always made a pull back after the first rebound. I have illustrated that with the circles. It never jumped aggressively to a new High. So as long as the Lower Low zone holds, it is a long term technical buy.
👑Best Signals (Forex/Crypto+70% accuracy) & Account Management (+20% profit/month on 10k accounts)
💰Free Channel t.me/tradingshotglobal
🤵Contact info@tradingshot.com t.me/tradingshot
🔥New service: next X100 crypto GEMS!
💰Free Channel t.me/tradingshotglobal
🤵Contact info@tradingshot.com t.me/tradingshot
🔥New service: next X100 crypto GEMS!
Thông báo miễn trừ trách nhiệm
Thông tin và ấn phẩm không có nghĩa là và không cấu thành, tài chính, đầu tư, kinh doanh, hoặc các loại lời khuyên hoặc khuyến nghị khác được cung cấp hoặc xác nhận bởi TradingView. Đọc thêm trong Điều khoản sử dụng.