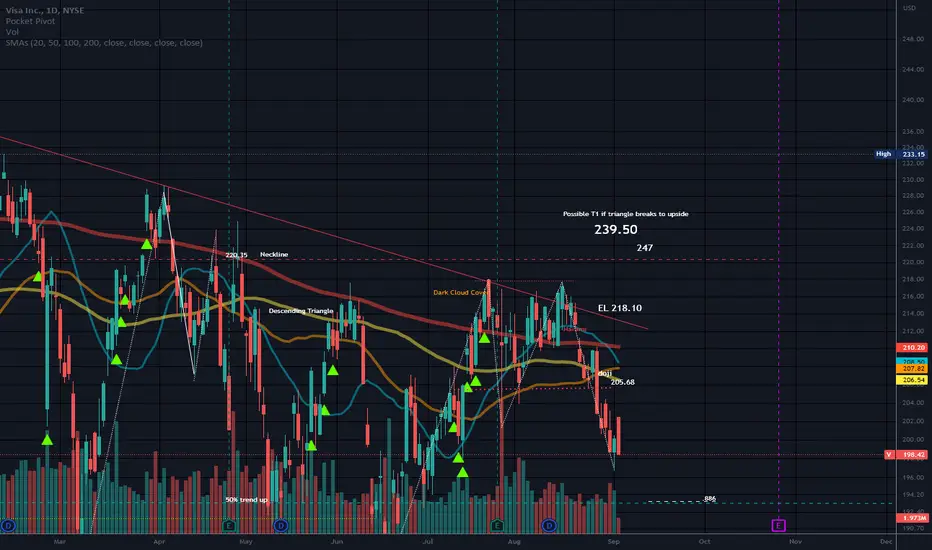
Price appears to be in a large Descending Triangle.
Neutral pattern until a trendline is broken.
Prior Head and Shoulders pattern.
Targets in orange below price are for a break of support of the triangle.
There is a Double bottom at the support line of the triangle.
Possible M structure forming. It is too early to tell.
Gaps noted below support line.
Price is still above the 50% level of the trend up measured from the Flu low.
No recommendation.
MA's chart is similar.
Thông báo miễn trừ trách nhiệm
Thông tin và ấn phẩm không có nghĩa là và không cấu thành, tài chính, đầu tư, kinh doanh, hoặc các loại lời khuyên hoặc khuyến nghị khác được cung cấp hoặc xác nhận bởi TradingView. Đọc thêm trong Điều khoản sử dụng.
Thông báo miễn trừ trách nhiệm
Thông tin và ấn phẩm không có nghĩa là và không cấu thành, tài chính, đầu tư, kinh doanh, hoặc các loại lời khuyên hoặc khuyến nghị khác được cung cấp hoặc xác nhận bởi TradingView. Đọc thêm trong Điều khoản sử dụng.