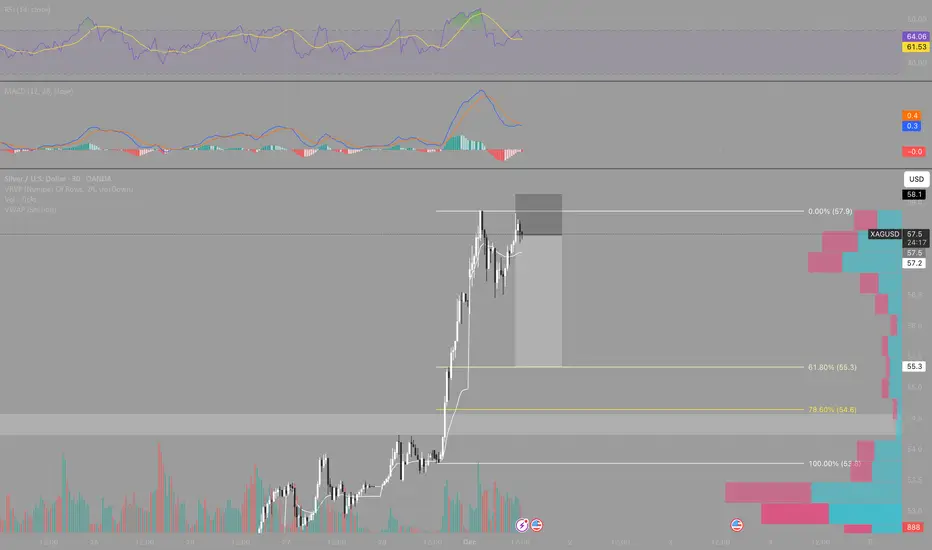
This is not a high-probability setup, but it is a tactical idea that can offer a good risk-to-reward with small risk: price is at resistance after a very vertical move, showing signs of exhaustion and some confluence with a potential bounce on the DXY.
The plan is a low-risk short with attractive R:R:
• Entry around the current rejection / highs.
• Tight stop above the recent high.
• Targets at corrective levels (VWAP / volume nodes / Fibonacci retracements of the last bullish leg).
The point is not to “catch the final top”, but to exploit a possible corrective move inside a broader uptrend on the higher timeframes.
In fact, the ideal scenario would be that this correction actually develops, so that:
1. Price and RSI can cool down from these extended levels.
2. A clear, confirmed support forms (reaction in price, volume, clean rejection).
3. Then we can look for long entries aligned with the main trend, with a much better structure and lower squeeze risk.
In short: the current short is a speculative trade with controlled risk and good potential R:R, but the higher-probability plan is still to let the correction play out and join the long side from a solid support.
Ghi chú
Quick update: price has now pushed back into the 78.6% retracement (~57.6) and is respecting the short-term descending trendline on M15, forming a potential lower high. The current M15 candle is the last one of the active H1 candle, so its close is key.• If this M15 candle closes bearish, it will leave a clean H1 rejection right at the 78.6% Fib.
• That same close would also favour a bearish MACD cross on M15, confirming loss of upside momentum exactly at resistance.
I am already in the short from this zone; a bearish close here would be the ideal confirmation for the scenario outlined earlier: corrective move lower from 78.6%, first target around 57.2–57.0 (where I plan to move the stop to break-even), with room for deeper downside if momentum picks up.
Ghi chú
In this kind of setup I always like to move my stop to breakeven as soon as the trade develops a bit, knowing it can reverse at any moment. It can feel frustrating to get tagged out at breakeven over and over, but it’s the best way to protect capital – especially when the whole point of the trade is simply to get exposure to a potentially larger move.I’m not trying to “be right”; I’m trying to participate in a move with a high risk-reward profile while risking as little as possible. That’s why I focus on zones where price often reacts and gives me the chance to get the trade to breakeven quickly.
Ghi chú
If we see a break above 57.3 its good signal to hold a little bit moreGiao dịch đang hoạt động
Okey okey, good signal, but we still observing the price and evaluating posible BEGhi chú
Im looking the price to reach 61.8% (57.0) and 78.6 (56.8) in 5 mins. If I see rejection and big volume here im out or BE, depend of the strength of the reactions.Ghi chú
We see a strong reaction in 5 mins candles but still respecting the HH and LL, so we looking now to see a continuation of this structure on lower timeframes. If we see some equal low or a break of the top trend line in 5 mins we should close the trade.Ghi chú
Im moving sl above the latest hh in lower timeframes aprox 57.7Ghi chú
I add an other point with very low risk an sl very closeGhi chú
two entries: 57.682 and 57.418 SL 57.9 TP 54.85Ghi chú
If the price reacts 57,271 outGhi chú
if breaks this zone down, we still holding a bit moreGhi chú
Good signal here: we just had a fake breakout on the lower timeframes above the intraday descending trendline and into the 61.8–78.6% zone, followed by an immediate rejection back below it.
• On the 1m/15m you can see price spike above the trendline, fail, and then dump back inside the short box, keeping the sequence of lower highs intact.
• The last push into ~57.5–57.7 was sold aggressively and we’re now trading back below the 61.8% retracement, with RSI and MACD rolling over again.
For now I’m still holding the short, but carefully:
• Bias remains to the downside as long as price stays below 57.5–57.6.
• The plan is the same: protect capital first (stop at breakeven as soon as possible) and let the position work only if the correction extends towards the lower levels discussed earlier.
Fake breakout + rejection at Fib resistance is a good confirmation for the idea, but it’s still a counter-trend trade, so risk management stays tight.
Ghi chú
fake fakeout??Ghi chú
or fake fake fakeout???Ghi chú
its a typical fake fake fake takeout fakeGhi chú
hold itGhi chú
Get ready for the roller coasterGhi chú
a hard trade its always a good tradeGhi chú
BulltrapGhi chú
We still thereGhi chú
hold on boy Ghi chú
Every body its out now so lets seeĐóng lệnh: dừng lỗ
we out, small loss SL hit on 57.9Thông báo miễn trừ trách nhiệm
Thông tin và các ấn phẩm này không nhằm mục đích, và không cấu thành, lời khuyên hoặc khuyến nghị về tài chính, đầu tư, giao dịch hay các loại khác do TradingView cung cấp hoặc xác nhận. Đọc thêm tại Điều khoản Sử dụng.
Thông báo miễn trừ trách nhiệm
Thông tin và các ấn phẩm này không nhằm mục đích, và không cấu thành, lời khuyên hoặc khuyến nghị về tài chính, đầu tư, giao dịch hay các loại khác do TradingView cung cấp hoặc xác nhận. Đọc thêm tại Điều khoản Sử dụng.