Gold traders, pay attention! We’re watching a textbook triangle pattern unfolding on the 1-hour timeframe for XAUUSD (Gold vs USD) — and the breakout could be just around the corner. Let’s break down what’s happening technically and why this setup could offer a high-probability opportunity.
🔺 Pattern Overview: Triangle Formation
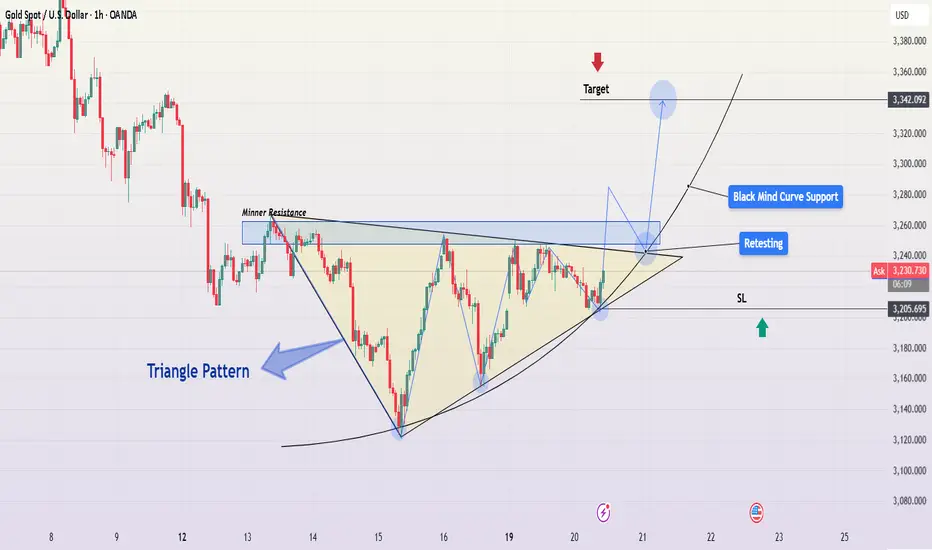
We’ve got a clear symmetrical triangle pattern developing — marked by converging trendlines of lower highs and higher lows. This type of structure often signals a buildup of pressure, a “coiling spring” waiting to explode in one direction. These patterns don’t last forever, and based on recent price action, we’re approaching the apex — which means a breakout is likely imminent.
📌 Key Technical Elements
🔷 1. Minor Resistance Zone
A minor resistance zone lies just above the upper triangle boundary. This area has previously acted as a ceiling where sellers stepped in. A decisive candle close above this level would confirm a breakout — turning this resistance into a potential new support.
🔷 2. Retesting Zone
After a breakout, it's common to see a retest of the breakout level. The chart anticipates this scenario with a projected pullback to the triangle edge. If price respects this zone and forms bullish candlestick patterns (like a bullish engulfing or pin bar), it could provide an ideal entry point with lower risk.
🔷 3. Black Mind Curve Support
There’s a curved support line acting as dynamic support beneath the triangle. This "Black Mind Curve" reflects broader market psychology — it's the path where bulls might step in again if price dips. It adds a second layer of confluence support for this trade setup.
📍 SL & Risk Management
The chart also defines a clear Stop Loss (SL) level around $3,205 — placed slightly below both the triangle’s lower boundary and the curved support. This is a sensible location to minimize downside while allowing room for minor volatility.
🛡️ Pro tip: Always risk only a small percentage of your account per trade — ideally 1-2%.
🎯 Projected Target: $3,342
If the breakout plays out as expected, the projected move targets the $3,342 level. This aligns with:
The height of the triangle projected from the breakout point (measured move)
Previous horizontal resistance and Fibonacci extension zones
This offers a strong risk-to-reward ratio, especially if entry is timed during the retest phase.
🧠 Market Psychology Insight
What’s happening under the surface?
Bulls are gradually stepping up, making higher lows.
Bears are losing steam as each push down is weaker than the last.
Volume is likely compressing, indicating a buildup of energy.
Once one side gains control (likely bulls based on this setup), a sharp impulsive move is expected.
💡 How to Trade This Setup
Wait for confirmation: Look for a strong bullish breakout candle above the triangle & minor resistance.
Entry Options:
Breakout entry on confirmation candle
Retest entry near triangle top (lower risk, better R:R)
Set SL below the triangle & curve (~$3,205)
Target: First take-profit at $3,280; second at $3,342+
📣 Final Thoughts:
This setup is a powerful blend of technical structure, support dynamics, and clear breakout potential. While nothing is guaranteed in trading, this is a high-quality formation that deserves a spot on your watchlist.
Let the market show its hand — don’t rush the entry. Wait for confirmation, manage your risk, and let the probabilities do the heavy lifting.
🔖 Tags:
#XAUUSD #GoldAnalysis #TrianglePattern #PriceAction #ForexTrading #BreakoutTrade #SwingTrade #TradingViewIdeas #TechnicalAnalysis #GoldBreakout #RiskManagement
🔺 Pattern Overview: Triangle Formation
We’ve got a clear symmetrical triangle pattern developing — marked by converging trendlines of lower highs and higher lows. This type of structure often signals a buildup of pressure, a “coiling spring” waiting to explode in one direction. These patterns don’t last forever, and based on recent price action, we’re approaching the apex — which means a breakout is likely imminent.
📌 Key Technical Elements
🔷 1. Minor Resistance Zone
A minor resistance zone lies just above the upper triangle boundary. This area has previously acted as a ceiling where sellers stepped in. A decisive candle close above this level would confirm a breakout — turning this resistance into a potential new support.
🔷 2. Retesting Zone
After a breakout, it's common to see a retest of the breakout level. The chart anticipates this scenario with a projected pullback to the triangle edge. If price respects this zone and forms bullish candlestick patterns (like a bullish engulfing or pin bar), it could provide an ideal entry point with lower risk.
🔷 3. Black Mind Curve Support
There’s a curved support line acting as dynamic support beneath the triangle. This "Black Mind Curve" reflects broader market psychology — it's the path where bulls might step in again if price dips. It adds a second layer of confluence support for this trade setup.
📍 SL & Risk Management
The chart also defines a clear Stop Loss (SL) level around $3,205 — placed slightly below both the triangle’s lower boundary and the curved support. This is a sensible location to minimize downside while allowing room for minor volatility.
🛡️ Pro tip: Always risk only a small percentage of your account per trade — ideally 1-2%.
🎯 Projected Target: $3,342
If the breakout plays out as expected, the projected move targets the $3,342 level. This aligns with:
The height of the triangle projected from the breakout point (measured move)
Previous horizontal resistance and Fibonacci extension zones
This offers a strong risk-to-reward ratio, especially if entry is timed during the retest phase.
🧠 Market Psychology Insight
What’s happening under the surface?
Bulls are gradually stepping up, making higher lows.
Bears are losing steam as each push down is weaker than the last.
Volume is likely compressing, indicating a buildup of energy.
Once one side gains control (likely bulls based on this setup), a sharp impulsive move is expected.
💡 How to Trade This Setup
Wait for confirmation: Look for a strong bullish breakout candle above the triangle & minor resistance.
Entry Options:
Breakout entry on confirmation candle
Retest entry near triangle top (lower risk, better R:R)
Set SL below the triangle & curve (~$3,205)
Target: First take-profit at $3,280; second at $3,342+
📣 Final Thoughts:
This setup is a powerful blend of technical structure, support dynamics, and clear breakout potential. While nothing is guaranteed in trading, this is a high-quality formation that deserves a spot on your watchlist.
Let the market show its hand — don’t rush the entry. Wait for confirmation, manage your risk, and let the probabilities do the heavy lifting.
🔖 Tags:
#XAUUSD #GoldAnalysis #TrianglePattern #PriceAction #ForexTrading #BreakoutTrade #SwingTrade #TradingViewIdeas #TechnicalAnalysis #GoldBreakout #RiskManagement
Bài đăng liên quan
Thông báo miễn trừ trách nhiệm
Thông tin và ấn phẩm không có nghĩa là và không cấu thành, tài chính, đầu tư, kinh doanh, hoặc các loại lời khuyên hoặc khuyến nghị khác được cung cấp hoặc xác nhận bởi TradingView. Đọc thêm trong Điều khoản sử dụng.
Thông báo miễn trừ trách nhiệm
Thông tin và ấn phẩm không có nghĩa là và không cấu thành, tài chính, đầu tư, kinh doanh, hoặc các loại lời khuyên hoặc khuyến nghị khác được cung cấp hoặc xác nhận bởi TradingView. Đọc thêm trong Điều khoản sử dụng.