PROTECTED SOURCE SCRIPT
Price Range Retrace statisticks [HERMAN]

📈 Price Range Retrace Stats [HERMAN]
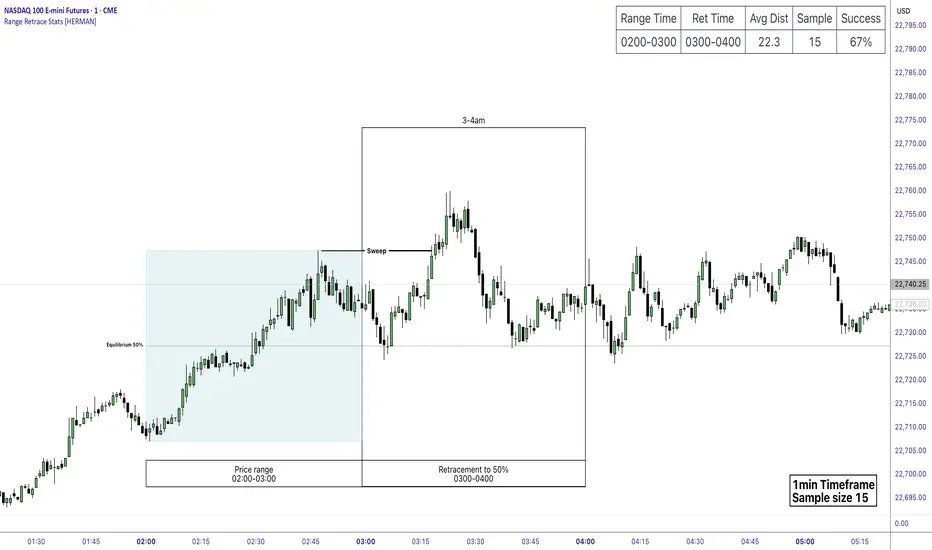
This indicator is designed to help traders quantify how often price retraces to a selected equilibrium level (e.g., 50%) after sweeping the high/low of a defined time-based range.
It is especially useful for modeling sessions such as the London Opening Range (e.g., 02:00–03:00 NY time), checking if price sweeps that range in a subsequent window (e.g., 03:00–04:00), and returns to its 50% level.
✅ What does it do?
Lets you define multiple time ranges (e.g. London, NY Open, custom ranges).
Draws the range box for the selected session time.
Calculates and plots the retracement level (default 50%).
Checks if price sweeps the high/low of the range before retracing.
Tracks success rate, average distance, sample size and displays these stats in a table.
⚙️ Key Features:
Fully customizable time windows (range box time and retracement check time).
-Configurable retracement % (default 50% equilibrium).
-Optional sweep condition (only count retracements if price sweeps the high/low first).
-Clean, theme-adaptive stats table with success rates and averages.
-Supports two independent levels (e.g. London and NY sessions).
📊 Why use it?
This tool turns session-based setups into statistical models:
Backtest session strategies over many days.
Quantify edge with % success over time.
Validate trading ideas with data.
Use probabilities instead of gut feeling.
Example insight you can track:
“Between 3–4 AM NY time, price swept the high/low of the 2–3 AM London Opening Range and returned to its 50% equilibrium level in 64% of 234 sessions.”
📌 Ideal for:
ICT concepts (Opening Range, Sweep, Equilibrium Return).
Algo developers wanting probabilities.
Anyone who wants data-driven confirmation for session range mean-reversion.
Instructions:
1️⃣ Enable the desired Price Range (1 or 2).
2️⃣ Set your Range Time (e.g. 02:00–03:00).
3️⃣ Set your Retracement Check Time (e.g. 03:00–04:00).
4️⃣ Choose retracement % (e.g. 50%).
5️⃣ Watch the box and retrace line plot on chart.
6️⃣ Review the success statistics in the table.
Mã được bảo vệ
Tập lệnh này được đăng dưới dạng mã nguồn đóng. Tuy nhiên, bạn có thể sử dụng tự do và không giới hạn – tìm hiểu thêm tại đây.
Thông báo miễn trừ trách nhiệm
Thông tin và các ấn phẩm này không nhằm mục đích, và không cấu thành, lời khuyên hoặc khuyến nghị về tài chính, đầu tư, giao dịch hay các loại khác do TradingView cung cấp hoặc xác nhận. Đọc thêm tại Điều khoản Sử dụng.