PROTECTED SOURCE SCRIPT
TradeChartist MA Tantalizer

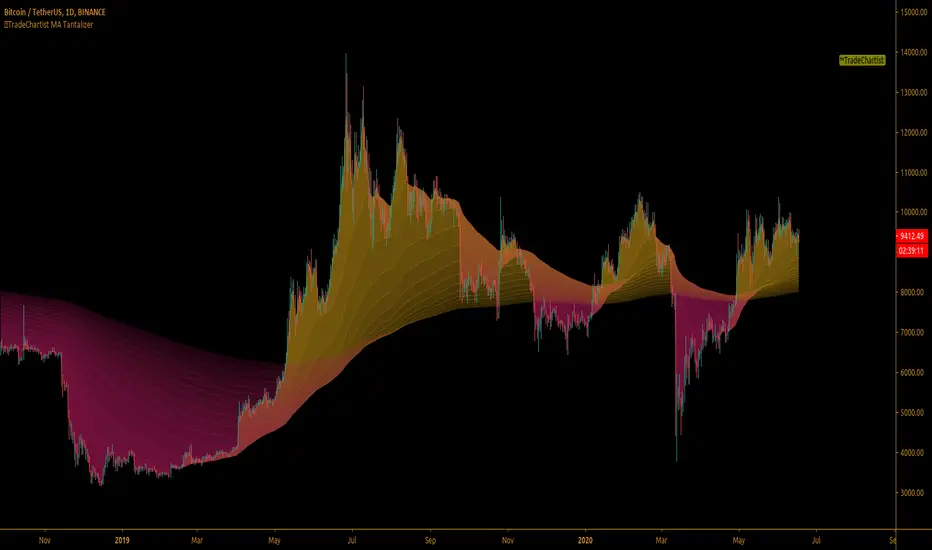
™TradeChartist MA Tantalizer is a free to use, elegantly designed script for MA based traders and it offers a range of useful Moving Averages based plots including MA fishnet/Tantalizer ribbon and custom multi time frame MAs with crosses based on user input. The script's visually appealing design and its functionality offers a pleasing experience for the users, thereby complementing their analysis and helps understand asset's price action better.
What does ™TradeChartist MA Tantalizer do?
1. MA Tantalizer plots Moving Averages Tantalizer (Fishnet or Tantalized) in user preferred color scheme based on selection from a dropdown of 10 MAs ( SMA , EMA , Zero-Lag EMA , SMMA , WMA , DEMA , TEMA , VIDYA ( Variable Index DYnamic Average ), T3 MA (developed by Tim Tillson featured in his article "Better Moving Averages" in 1998), Modified T3 MA ). If length input is 10, Tantalizer plots 15 MA plots ranging from 10 MA to 150 MA. The Tantalized MAs help the traders to visually spot price trends and along with MTF (Multi Time Frame) MA plots with detection of crosses within the script, help traders make an informed trade decision. 15 MA plots can be individually plotted or hidden from the indicator settings.

2. Plots two MAs based on user input length and timeframe which helps detect MA crosses as shown below.


3. Generates Signal for MA crosses that can be plugged as Signal Connector and used with Plug and Trade scripts as below.

The sheer number of interesting things that can be done with this script from plotting visually engaging MA Tantalizer and detecting MA crosses not just on chart Timeframe, but also crosses between MAs of different timeframes, makes this script quite versatile and a real Tantalizer.
What does ™TradeChartist MA Tantalizer do?
1. MA Tantalizer plots Moving Averages Tantalizer (Fishnet or Tantalized) in user preferred color scheme based on selection from a dropdown of 10 MAs ( SMA , EMA , Zero-Lag EMA , SMMA , WMA , DEMA , TEMA , VIDYA ( Variable Index DYnamic Average ), T3 MA (developed by Tim Tillson featured in his article "Better Moving Averages" in 1998), Modified T3 MA ). If length input is 10, Tantalizer plots 15 MA plots ranging from 10 MA to 150 MA. The Tantalized MAs help the traders to visually spot price trends and along with MTF (Multi Time Frame) MA plots with detection of crosses within the script, help traders make an informed trade decision. 15 MA plots can be individually plotted or hidden from the indicator settings.
2. Plots two MAs based on user input length and timeframe which helps detect MA crosses as shown below.
3. Generates Signal for MA crosses that can be plugged as Signal Connector and used with Plug and Trade scripts as below.
The sheer number of interesting things that can be done with this script from plotting visually engaging MA Tantalizer and detecting MA crosses not just on chart Timeframe, but also crosses between MAs of different timeframes, makes this script quite versatile and a real Tantalizer.
Mã được bảo vệ
Tập lệnh này được đăng dưới dạng mã nguồn đóng. Tuy nhiên, bạn có thể sử dụng tự do và không giới hạn – tìm hiểu thêm tại đây.
Get in touch with me if you would like access to my Premium scripts for a trial before deciding on lifetime access.
Telegram - @Trade_Chartist
Free Scripts - bit.ly/Free-Scripts
Telegram - @Trade_Chartist
Free Scripts - bit.ly/Free-Scripts
Thông báo miễn trừ trách nhiệm
Thông tin và các ấn phẩm này không nhằm mục đích, và không cấu thành, lời khuyên hoặc khuyến nghị về tài chính, đầu tư, giao dịch hay các loại khác do TradingView cung cấp hoặc xác nhận. Đọc thêm tại Điều khoản Sử dụng.