OPEN-SOURCE SCRIPT
Cập nhật Jdawg Sentiment Momentum Oscillator Enhanced
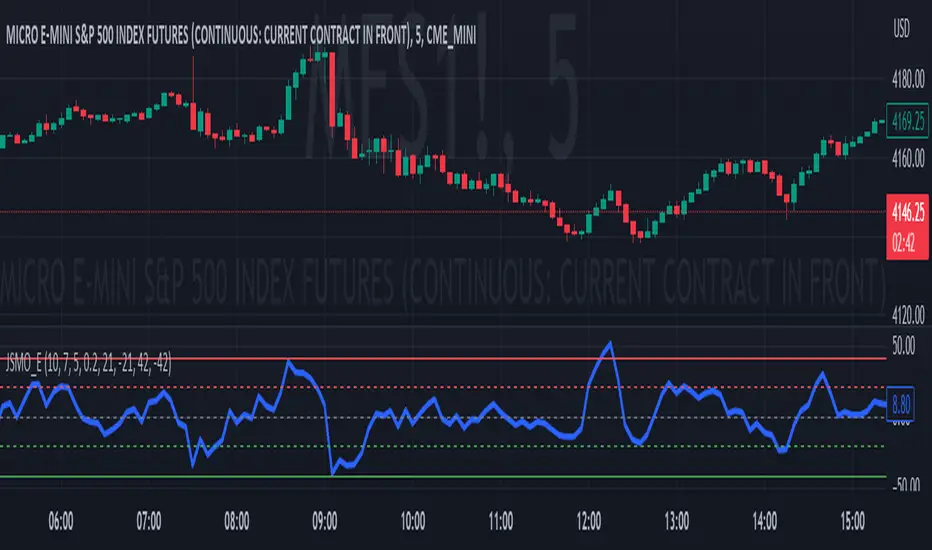
The Jdawg Sentiment Momentum Oscillator Enhanced (JSMO_E) is a versatile technical analysis indicator designed to provide traders with insights into potential trend changes and overbought or oversold market conditions. JSMO_E combines the principles of the Relative Strength Index (RSI), the Simple Moving Average (SMA), and the Rate of Change (ROC) to create a comprehensive tool for assessing market sentiment and momentum.
The uniqueness of JSMO_E lies in its ability to integrate the RSI, SMA of RSI, and ROC of RSI, while also allowing users to customize the weight of the ROC component. This combination of features is not commonly found in other indicators, which increases its distinctiveness.
To effectively use JSMO_E, follow these steps:
Apply the JSMO_E indicator to the price chart of the asset you are analyzing.
Observe the plotted JSMO_E line in relation to the zero line, overbought, and oversold levels.
When the JSMO_E line crosses above the zero line, it may signal the beginning of an uptrend or bullish momentum. Conversely, when the JSMO_E line crosses below the zero line, it may indicate the start of a downtrend or bearish momentum.
Overbought and oversold levels, marked by the red and green dashed lines, respectively, can serve as a warning that a trend reversal may be imminent. When the JSMO_E line reaches or surpasses the overbought level, it might indicate that the asset is overvalued and could experience a price decline. Conversely, when the JSMO_E line reaches or goes below the oversold level, it can signal that the asset is undervalued and may experience a price increase.
Adjust the input parameters (RSI Period, SMA Period, ROC Period, and ROC Weight) as needed to optimize the indicator for the specific market and time frame you are analyzing.
The JSMO_E indicator is suitable for various markets, including stocks, forex, commodities, and cryptocurrencies. However, its effectiveness may vary depending on the market conditions and time frames used. It is recommended to use JSMO_E in conjunction with other technical analysis tools and methods to confirm potential trade setups and improve overall trading performance. Always conduct thorough backtesting and forward-testing before employing any indicator in a live trading environment.
Phát hành các Ghi chú
3 updates:1. Changed first level of overbought/oversold values to 21/-21 instead of 13/-13.
2. Multiple Overbought/Oversold Levels: Added two overbought/oversold levels (21/-21 and 42/-42) to represent varying degrees of overbought/oversold conditions.
3. Different Line Styles: Changed the line styles for the overbought/oversold levels. I used dashed lines for the 21/-21 levels and solid lines for the 42/-42 levels.
Mã nguồn mở
Theo đúng tinh thần TradingView, tác giả của tập lệnh này đã công bố nó dưới dạng mã nguồn mở, để các nhà giao dịch có thể xem xét và xác minh chức năng. Chúc mừng tác giả! Mặc dù bạn có thể sử dụng miễn phí, hãy nhớ rằng việc công bố lại mã phải tuân theo Nội quy.
Enjoy my insights? ☕ Fuel my next analysis by buying me a coffee! buymeacoffee.com/jbbarrett231
Thông báo miễn trừ trách nhiệm
Thông tin và các ấn phẩm này không nhằm mục đích, và không cấu thành, lời khuyên hoặc khuyến nghị về tài chính, đầu tư, giao dịch hay các loại khác do TradingView cung cấp hoặc xác nhận. Đọc thêm tại Điều khoản Sử dụng.