OPEN-SOURCE SCRIPT
Cập nhật Greer Book Value Yield

📘 Script Title
Greer Book Value Yield – Valuation Insight Based on Balance Sheet Strength
🧾 Description
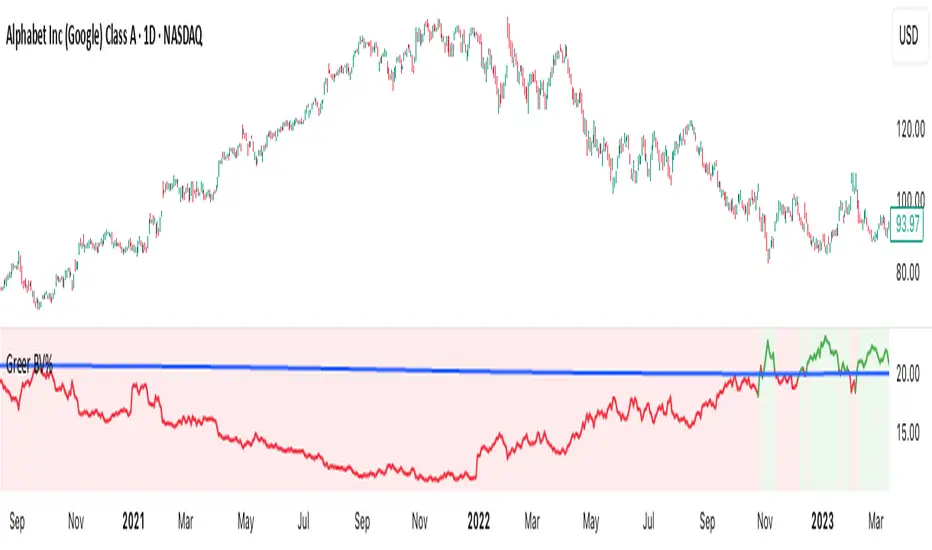
Greer Book Value Yield is a valuation-focused indicator in the Greer Financial Toolkit, designed to evaluate how much net asset value (book value) a company provides per share relative to its current market price. This script calculates the Book Value Per Share Yield (BV%) using the formula:
Book Value Yield (%) = Book Value Per Share ÷ Stock Price × 100
This yield helps investors assess whether a stock is trading at a discount or premium to its underlying assets. It dynamically highlights when the yield is:
🟢 Above its historical average (potentially undervalued)
🔴 Below its historical average (potentially overvalued)
🔍 Use Case
Analyze valuation through asset-based metrics
Identify buy opportunities when book value yield is historically high
Combine with other scripts in the Greer Financial Toolkit:
📘 Greer Value – Tracks year-over-year growth consistency across six key metrics
📊 Greer Value Yields Dashboard – Visualizes multiple valuation-based yields
🟢 Greer BuyZone – Highlights long-term technical buy zones
🛠️ Inputs & Data
Uses Book Value Per Share (BVPS) from TradingView’s financial database (Fiscal Year)
Calculates and compares against a static average yield to assess historical valuation
Clean visual feedback via dynamic coloring and overlays
⚠️ Disclaimer
This tool is for educational and informational purposes only and should not be considered financial advice. Always conduct your own research before making investment decisions.
Phát hành các Ghi chú
Added Book Value Stat to the display.status_line for referenceMã nguồn mở
Theo đúng tinh thần TradingView, tác giả của tập lệnh này đã công bố nó dưới dạng mã nguồn mở, để các nhà giao dịch có thể xem xét và xác minh chức năng. Chúc mừng tác giả! Mặc dù bạn có thể sử dụng miễn phí, hãy nhớ rằng việc công bố lại mã phải tuân theo Nội quy.
Thông báo miễn trừ trách nhiệm
Thông tin và các ấn phẩm này không nhằm mục đích, và không cấu thành, lời khuyên hoặc khuyến nghị về tài chính, đầu tư, giao dịch hay các loại khác do TradingView cung cấp hoặc xác nhận. Đọc thêm tại Điều khoản Sử dụng.
Mã nguồn mở
Theo đúng tinh thần TradingView, tác giả của tập lệnh này đã công bố nó dưới dạng mã nguồn mở, để các nhà giao dịch có thể xem xét và xác minh chức năng. Chúc mừng tác giả! Mặc dù bạn có thể sử dụng miễn phí, hãy nhớ rằng việc công bố lại mã phải tuân theo Nội quy.
Thông báo miễn trừ trách nhiệm
Thông tin và các ấn phẩm này không nhằm mục đích, và không cấu thành, lời khuyên hoặc khuyến nghị về tài chính, đầu tư, giao dịch hay các loại khác do TradingView cung cấp hoặc xác nhận. Đọc thêm tại Điều khoản Sử dụng.