PROTECTED SOURCE SCRIPT
Resistance & Support
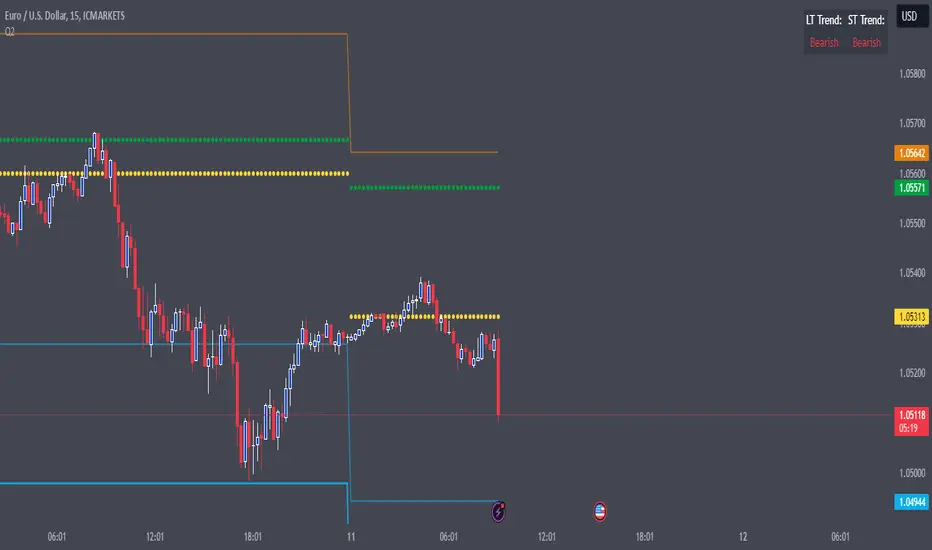
This indicator combines multiple analytical methods to calculate potential support and resistance levels for the upcoming trading day, leveraging historical price data. The calculations are based on three key areas:
Pivot Points: These are calculated using the previous day's high, low, and close values to provide central price levels, along with first and second-level support and resistance (S1, S2, R1, R2). These levels are commonly used in technical analysis and can serve as reference points for market entries and exits.
3-Day Price Average (3DBP): This value provides a short-term trend signal by averaging the high, low, and close prices over the past three days. The indicator helps identify whether the market has been trading at higher or lower levels recently, which can signal bullish or bearish trends.
Trend Detection: The script also includes a short-term and long-term trend analysis:
Short-Term Trend: The prior day’s 3DBP is compared to the previous day’s 3DBP to gauge the market's short-term direction.
Long-Term Trend: The prior close is compared to the open from 50 days ago, offering an indication of the overall market trend.
These components work together to provide actionable insights on potential entry points. For example:
In a bullish market, support levels may act as potential entry points for long trades when the price retraces.
In a bearish market, resistance levels may act as potential entry points for short trades upon price rejection.
The Trend Table at the top right of the chart displays the short-term and long-term trend information for quick reference. It shows whether the trends are bullish or bearish based on the calculations above.
While originally optimized for the EUR/USD currency pair, this indicator can be applied to other forex pairs. However, results may vary depending on the instrument, and further testing is recommended for non-EUR/USD pairs.
Usage Notes:
Pivot points can often act as both support and resistance. While they provide useful reference levels, in volatile markets, these levels may not always hold. Tight stop-losses are recommended if trading near these levels.
The 3DBP offers insight into past market behavior, and although it’s not guaranteed to act as support or resistance, it can help identify zones of interest in the short term.
This indicator is designed to provide a structured approach to price action analysis, incorporating widely-recognized methods like pivot points and trend detection, while adding unique elements like the 3DBP to enhance its utility.
Mã được bảo vệ
Tập lệnh này được đăng dưới dạng mã nguồn đóng. Tuy nhiên, bạn có thể sử dụng tự do và không giới hạn – tìm hiểu thêm tại đây.
Thông báo miễn trừ trách nhiệm
Thông tin và các ấn phẩm này không nhằm mục đích, và không cấu thành, lời khuyên hoặc khuyến nghị về tài chính, đầu tư, giao dịch hay các loại khác do TradingView cung cấp hoặc xác nhận. Đọc thêm tại Điều khoản Sử dụng.