OPEN-SOURCE SCRIPT
Cập nhật Short Term IndeX
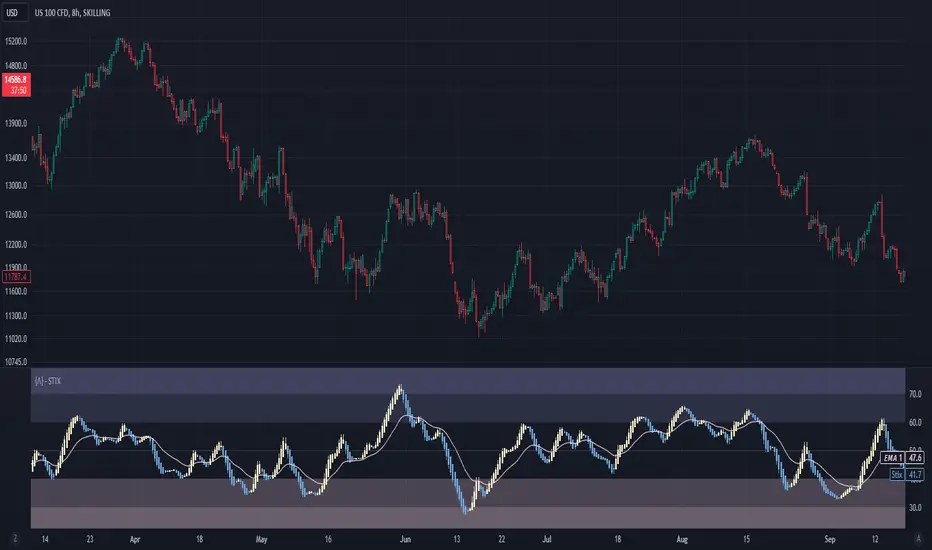
The Short-Term Index (STIX) is a simple market indicator designed to assess short-term overbought or oversold conditions in the stock market. Leveraging a combination of advancing and declining issues, STIX provides valuable insights into market sentiment and potential reversals. To enhance its interpretability and reveal the underlying trend with greater clarity, STIX has been refined through a Heiken-Ashi transformation, ensuring a smoother representation of market dynamics.
Calculation and Methodology:
Pine Script®
STIX is calculated by dividing the difference between the sum of advancing issues (ADV) by the total number of issues traded (ADV + DEC). This quotient is multiplied by 100 to express the result as a percentage. The STIX index ranges from 0 to 100, where extreme values indicate potential overbought (mainly above 60) or oversold (mainly below 40) market conditions.
Heiken-Ashi Transformation:
By applying a Heiken-Ashi transformation to STIX, the indicator gains improved visual clarity and noise reduction. This transformation enhances the ability to identify trend shifts and potential reversal points, making it an even more valuable tool for traders and investors.
Utility and Use Cases:
-The Short-Term Index (STIX) offers a range of practical applications-
1. Overbought/Oversold Conditions: STIX provides a clear indication of short-term overbought or oversold conditions, helping traders anticipate potential market reversals.
2. Reversal Points: STIX can help pinpoint potential reversal points in short-term market trends, providing traders with opportunities to enter or exit positions.

3. Trend Analysis: By observing STIX values over time, traders can assess the strength and sustainability of short-term trends, aiding in trend-following strategies.

The Short-Term Index (STIX), enhanced by its Heiken-Ashi transformation, equips traders and investors with a tool for assessing short-term market conditions, confirming price movements, and identifying potential reversal points. Its robust methodology and refined presentation contribute to a more comprehensive understanding of short-term market dynamics, enabling traders to make well-informed trading decisions.
See Also:
- Other Market Breadth Indicators-


Calculation and Methodology:
stix = ta.ema(adv / (adv + dec) * 100, len)
STIX is calculated by dividing the difference between the sum of advancing issues (ADV) by the total number of issues traded (ADV + DEC). This quotient is multiplied by 100 to express the result as a percentage. The STIX index ranges from 0 to 100, where extreme values indicate potential overbought (mainly above 60) or oversold (mainly below 40) market conditions.
Heiken-Ashi Transformation:
By applying a Heiken-Ashi transformation to STIX, the indicator gains improved visual clarity and noise reduction. This transformation enhances the ability to identify trend shifts and potential reversal points, making it an even more valuable tool for traders and investors.
Utility and Use Cases:
-The Short-Term Index (STIX) offers a range of practical applications-
1. Overbought/Oversold Conditions: STIX provides a clear indication of short-term overbought or oversold conditions, helping traders anticipate potential market reversals.
2. Reversal Points: STIX can help pinpoint potential reversal points in short-term market trends, providing traders with opportunities to enter or exit positions.
3. Trend Analysis: By observing STIX values over time, traders can assess the strength and sustainability of short-term trends, aiding in trend-following strategies.
The Short-Term Index (STIX), enhanced by its Heiken-Ashi transformation, equips traders and investors with a tool for assessing short-term market conditions, confirming price movements, and identifying potential reversal points. Its robust methodology and refined presentation contribute to a more comprehensive understanding of short-term market dynamics, enabling traders to make well-informed trading decisions.
See Also:
- Other Market Breadth Indicators-
Phát hành các Ghi chú
Improved code methodology.Added
Phát hành các Ghi chú
improved methodology, added support for plot export to new SuperTrend ToolKitMã nguồn mở
Theo đúng tinh thần TradingView, tác giả của tập lệnh này đã công bố nó dưới dạng mã nguồn mở, để các nhà giao dịch có thể xem xét và xác minh chức năng. Chúc mừng tác giả! Mặc dù bạn có thể sử dụng miễn phí, hãy nhớ rằng việc công bố lại mã phải tuân theo Nội quy.
Thông báo miễn trừ trách nhiệm
Thông tin và các ấn phẩm này không nhằm mục đích, và không cấu thành, lời khuyên hoặc khuyến nghị về tài chính, đầu tư, giao dịch hay các loại khác do TradingView cung cấp hoặc xác nhận. Đọc thêm tại Điều khoản Sử dụng.
Mã nguồn mở
Theo đúng tinh thần TradingView, tác giả của tập lệnh này đã công bố nó dưới dạng mã nguồn mở, để các nhà giao dịch có thể xem xét và xác minh chức năng. Chúc mừng tác giả! Mặc dù bạn có thể sử dụng miễn phí, hãy nhớ rằng việc công bố lại mã phải tuân theo Nội quy.
Thông báo miễn trừ trách nhiệm
Thông tin và các ấn phẩm này không nhằm mục đích, và không cấu thành, lời khuyên hoặc khuyến nghị về tài chính, đầu tư, giao dịch hay các loại khác do TradingView cung cấp hoặc xác nhận. Đọc thêm tại Điều khoản Sử dụng.