PROTECTED SOURCE SCRIPT
MomentumQ Sector Matrix
MomentumQ Sector Matrix — Multi-Timeframe & Sector Performance Dashboard
The MomentumQ Sector Matrix is a professional dashboard-style indicator designed to help traders quickly evaluate sector performance and momentum alignment across multiple timeframes.
It provides an instant visual snapshot of how each major U.S. sector is performing, helping traders identify strength, weakness, and rotation trends without switching between charts.
What It Does
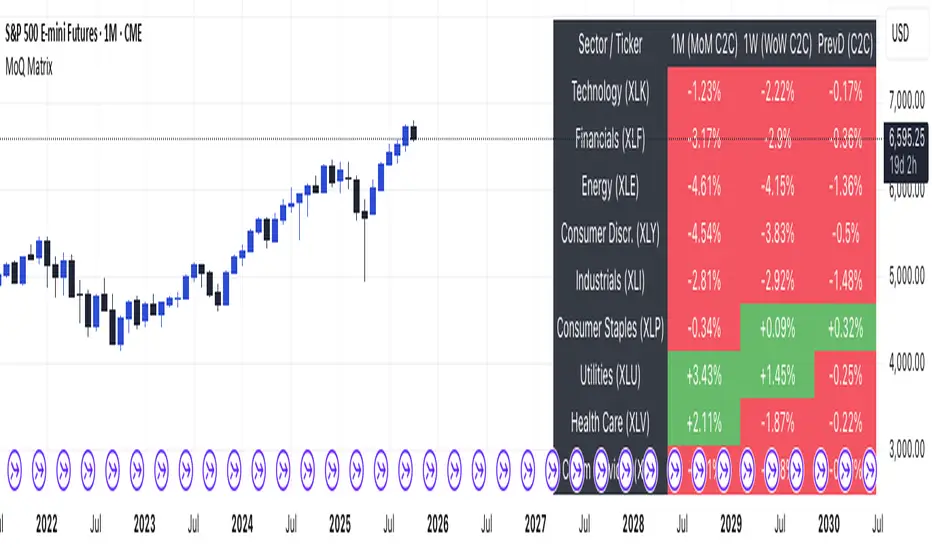
MomentumQ Sector Matrix consolidates multi-timeframe return data (1-Month, 1-Week, and 1-Day) into a clean, color-coded table.
Each sector’s cell displays percentage performance, automatically colored green or red based on relative gains or losses.
This tool serves as a sector rotation map, letting traders:
Key Features
1. Multi-Timeframe Sector Overview
Displays percentage returns for major SPDR sectors on 1-Month, 1-Week, and 1-Day bases.
Toggle between Today and PrevD (previous day) return modes.
2. Adaptive Table Layout
Fully resizable — choose Small, Medium, or Large table sizes for the best fit on your chart.
Works seamlessly with both light and dark TradingView themes.
3. Light / Dark Mode Support
Switch between modes to automatically match your chart background.
4. Performance-Based Coloring
Green for positive returns, red for negative, gray for neutral.
Provides clear visual contrast even in compact layouts.
5. Instant Market Context
Gain quick insight into overall market strength or weakness.
Ideal for top-down analysis, ETF rotation strategies, and macro confirmation.
How to Use
Why It’s Valuable
Disclaimer
This indicator is a technical analysis tool for educational and informational purposes only.
It does not constitute financial advice and does not guarantee profitability.
Always perform your own analysis and use proper risk management.
The MomentumQ Sector Matrix is a professional dashboard-style indicator designed to help traders quickly evaluate sector performance and momentum alignment across multiple timeframes.
It provides an instant visual snapshot of how each major U.S. sector is performing, helping traders identify strength, weakness, and rotation trends without switching between charts.
What It Does
MomentumQ Sector Matrix consolidates multi-timeframe return data (1-Month, 1-Week, and 1-Day) into a clean, color-coded table.
Each sector’s cell displays percentage performance, automatically colored green or red based on relative gains or losses.
This tool serves as a sector rotation map, letting traders:
- Spot which parts of the market are leading or lagging
- Track momentum alignment across monthly, weekly, and daily timeframes
- Instantly identify broad market conditions (risk-on vs. risk-off)
Key Features
1. Multi-Timeframe Sector Overview
Displays percentage returns for major SPDR sectors on 1-Month, 1-Week, and 1-Day bases.
Toggle between Today and PrevD (previous day) return modes.
2. Adaptive Table Layout
Fully resizable — choose Small, Medium, or Large table sizes for the best fit on your chart.
Works seamlessly with both light and dark TradingView themes.
3. Light / Dark Mode Support
Switch between modes to automatically match your chart background.
4. Performance-Based Coloring
Green for positive returns, red for negative, gray for neutral.
Provides clear visual contrast even in compact layouts.
5. Instant Market Context
Gain quick insight into overall market strength or weakness.
Ideal for top-down analysis, ETF rotation strategies, and macro confirmation.
How to Use
- Add the indicator to any chart (symbol-independent).
- Choose your preferred table position and size in the settings panel.
- Use 1M / 1W / 1D readings to align your trading bias with higher-timeframe context.
Why It’s Valuable
- Consolidates sector analysis into a single, easy-to-read dashboard
- Helps identify macro trends and sector leadership quickly
- Supports both swing and intraday trading approaches
- Complements existing momentum or regime-tracking systems
Disclaimer
This indicator is a technical analysis tool for educational and informational purposes only.
It does not constitute financial advice and does not guarantee profitability.
Always perform your own analysis and use proper risk management.
Mã được bảo vệ
Tập lệnh này được đăng dưới dạng mã nguồn đóng. Tuy nhiên, bạn có thể sử dụng tự do và không giới hạn – tìm hiểu thêm tại đây.
Thông báo miễn trừ trách nhiệm
Thông tin và các ấn phẩm này không nhằm mục đích, và không cấu thành, lời khuyên hoặc khuyến nghị về tài chính, đầu tư, giao dịch hay các loại khác do TradingView cung cấp hoặc xác nhận. Đọc thêm tại Điều khoản Sử dụng.