OPEN-SOURCE SCRIPT
Cập nhật Multi-timeframe Stochastic RSI
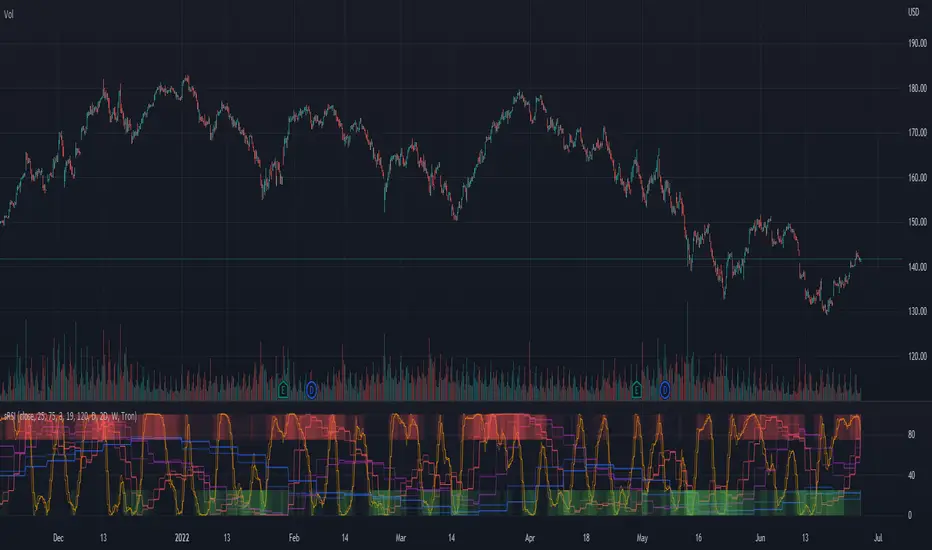
The multi-timeframe stochastic RSI utilizes stochastic RSI signals from 11 different time-frames to indicate whether overbought/oversold signals are in agreement or not across time-frames. Ideally traders should enter and exit when conditions are in agreement as indicated by the intensity of the long (green) or short (red) bands at the top and bottom of the indicator. The intensity of the bands indicates how many of the time-frames are currently overbought/oversold.
Phát hành các Ghi chú
Updated script so that it auto adjust to the chart time-frame. Phát hành các Ghi chú
Script now auto-adjusts the time-frames used in the oversold and overbought regions as well as the time-frames displayed to the timeframe of the chart.Selecting "manual sRSI" allows you to adjust the time-frames displayed, but not the timeframes used for the oversold and overbought regions.
Selecting "I have free TV" adjusts the chart to only use the basic timeframes.
Minor edits to retain original functionality: Select "I have free TV" and "Manual sRSI" for v1 behavior.
Mã nguồn mở
Theo đúng tinh thần TradingView, tác giả của tập lệnh này đã công bố nó dưới dạng mã nguồn mở, để các nhà giao dịch có thể xem xét và xác minh chức năng. Chúc mừng tác giả! Mặc dù bạn có thể sử dụng miễn phí, hãy nhớ rằng việc công bố lại mã phải tuân theo Nội quy.
Thông báo miễn trừ trách nhiệm
Thông tin và các ấn phẩm này không nhằm mục đích, và không cấu thành, lời khuyên hoặc khuyến nghị về tài chính, đầu tư, giao dịch hay các loại khác do TradingView cung cấp hoặc xác nhận. Đọc thêm tại Điều khoản Sử dụng.