OPEN-SOURCE SCRIPT
Improved Z-Score Overlay
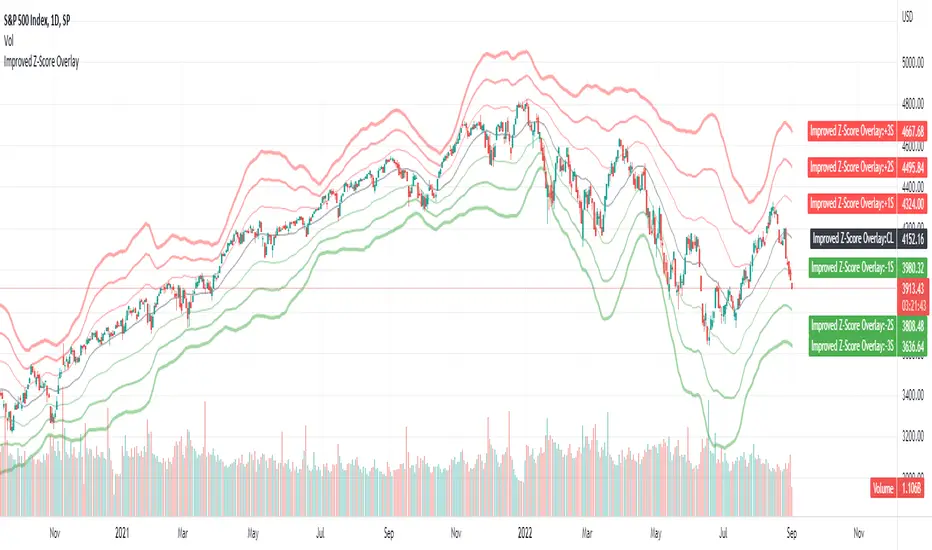
Last month I published an improved z-score script that goes underneath your chart, which helps to highlight overbought or oversold regimes. It is customizable, and allows changing the periods, whether smoothing capability is desired, whether to use simple or exponential moving averages, and which data source to use (open, high, low, close, ohlc4).
Some individuals may find that it is most useful not only to have the z-score visible underneath their price chart, but have the sigma values clearly visible on the chart itself to determine overbought or oversold levels.
Therefore, this improved z-score overlay script will place the centerline of price on the chart, and +3/+2/+1/0/-1/-2/-3 sigma.
These can be disabled if some values do not want to be shown, and the colors / opacity can be changed.
Additionally, you could also put this into a new pane below your chart and disable all of the +3 to -3 sigma values, and enable the "Z-Score" button. This will allow you to replicate the original Improved Z-Score Script.
If anyone has questions or would like to have any improvements made, let me know :)
- Jim Bosse
Mã nguồn mở
Theo đúng tinh thần TradingView, tác giả của tập lệnh này đã công bố nó dưới dạng mã nguồn mở, để các nhà giao dịch có thể xem xét và xác minh chức năng. Chúc mừng tác giả! Mặc dù bạn có thể sử dụng miễn phí, hãy nhớ rằng việc công bố lại mã phải tuân theo Nội quy.
Thông báo miễn trừ trách nhiệm
Thông tin và các ấn phẩm này không nhằm mục đích, và không cấu thành, lời khuyên hoặc khuyến nghị về tài chính, đầu tư, giao dịch hay các loại khác do TradingView cung cấp hoặc xác nhận. Đọc thêm tại Điều khoản Sử dụng.