OPEN-SOURCE SCRIPT
Volume Stats
Description:
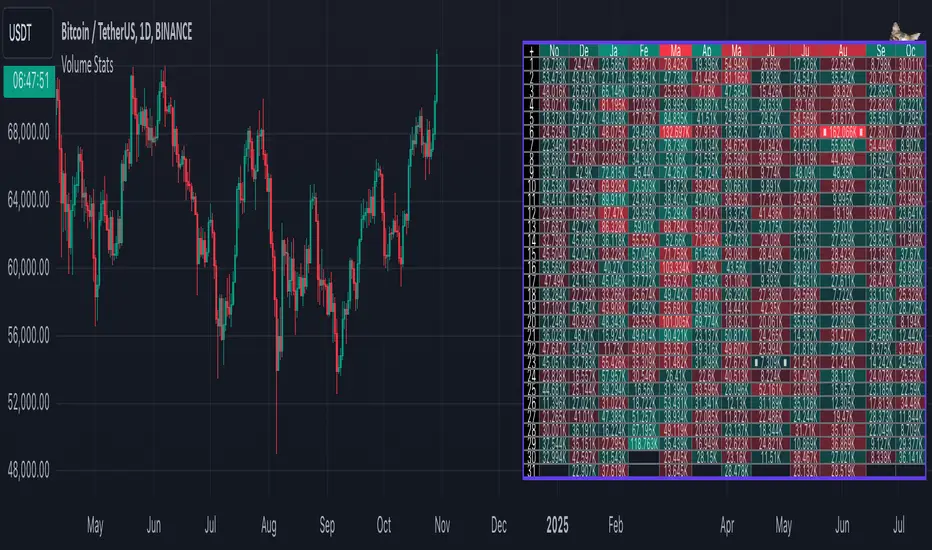
Volume Stats displays volume data and statistics for every day of the year, and is designed to work on "1D" timeframe. The data is displayed in a table with columns being months of the year, and rows being days of each month. By default, latest data is displayed, but you have an option to switch to data of the previous year as well.
The statistics displayed for each day is:
- volume
- % of total yearly volume
- % of total monthly volume
The statistics displayed for each column (month) is:
- monthly volume
- % of total yearly volume
- sentiment (was there more bullish or bearish volume?)
- min volume (on which day of the month was the min volume)
- max volume (on which day of the month was the max volume)
The cells change their colors depending on whether the volume is bullish or bearish, and what % of total volume the current cell has (either yearly or monthly). The header cells also change their color (based either on sentiment or what % of yearly volume the current month has).
This is the first (and free) version of the indicator, and I'm planning to create a "PRO" version of this indicator in future.
Parameters:
- Timezone
- Cell data -> which data to display in the cells (no data, volume or percentage)
- Highlight min and max volume -> if checked, cells with min and max volume (either monthly or yearly) will be highlighted with a dot or letter (depending on the "Cell data" input)
- Cell stats mode -> which data to use for color and % calculation (All data = yearly, Column = monthly)
- Display data from previous year -> if checked, the data from previous year will be used
- Header color is calculated from -> either sentiment or % of the yearly volume
- Reverse theme -> the table colors are automatically changed based on the "Dark mode" of Tradingview, this checkbox reverses the logic (so that darker colors will be used when "Dark mode" is off, and lighter colors when it's on)
- Hide logo -> hides the cat logo (PLEASE DO NOT HIDE THE CAT)
Conclusion:
Let me know what you think of the indicator. As I said, I'm planning to make a PRO version with more features, for which I already have some ideas, but if you have any suggestions, please let me know.
Mã nguồn mở
Theo đúng tinh thần TradingView, tác giả của tập lệnh này đã công bố nó dưới dạng mã nguồn mở, để các nhà giao dịch có thể xem xét và xác minh chức năng. Chúc mừng tác giả! Mặc dù bạn có thể sử dụng miễn phí, hãy nhớ rằng việc công bố lại mã phải tuân theo Nội quy.
Thông báo miễn trừ trách nhiệm
Thông tin và các ấn phẩm này không nhằm mục đích, và không cấu thành, lời khuyên hoặc khuyến nghị về tài chính, đầu tư, giao dịch hay các loại khác do TradingView cung cấp hoặc xác nhận. Đọc thêm tại Điều khoản Sử dụng.