OPEN-SOURCE SCRIPT
Volume HeatMap Divergence [BigBeluga]

🔵 OVERVIEW
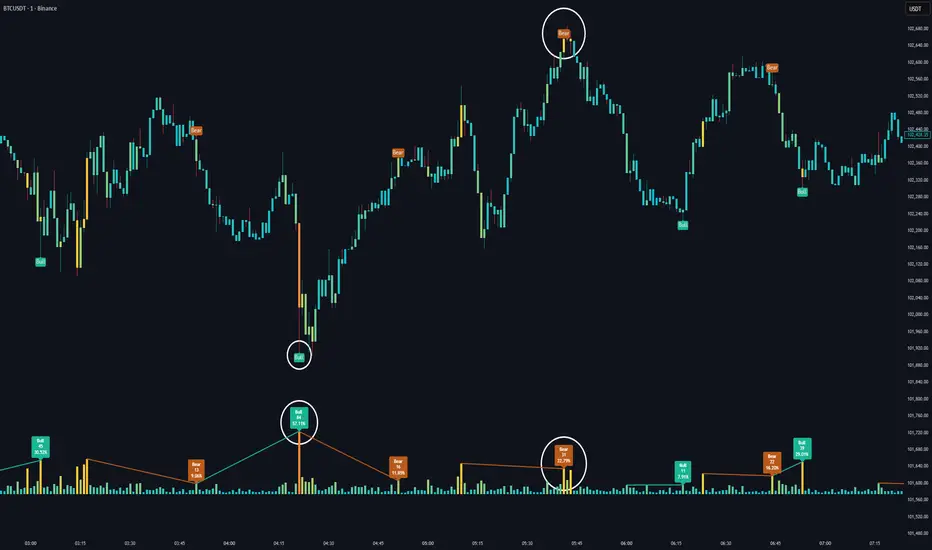
The Volume HeatMap Divergence [BigBeluga] is a smart volume visualization tool that overlays normalized volume data directly on the chart. Using a color heatmap from aqua to red, it transforms raw volume into an intuitive scale — highlighting areas of weak to intense market participation. Additionally, it detects volume-based divergences from price to signal potential reversals or exhaustion zones. Combined with clear visual labeling, this tool empowers traders with actionable volume insights.
🔵 CONCEPTS
🔵 FEATURES
🔵 HOW TO USE
🔵 CONCLUSION
Volume HeatMap Divergence [BigBeluga] merges heatmap-style volume visualization with intelligent divergence detection — giving traders a clean yet powerful edge. By revealing hidden disconnections between price and participation, it helps users spot exhaustion moves or hidden accumulation zones before the market reacts. Whether you’re a scalper, swing trader, or intraday strategist, this tool offers real-time clarity on who’s in control behind the candles.
The Volume HeatMap Divergence [BigBeluga] is a smart volume visualization tool that overlays normalized volume data directly on the chart. Using a color heatmap from aqua to red, it transforms raw volume into an intuitive scale — highlighting areas of weak to intense market participation. Additionally, it detects volume-based divergences from price to signal potential reversals or exhaustion zones. Combined with clear visual labeling, this tool empowers traders with actionable volume insights.
🔵 CONCEPTS
- Normalized Volume Heatmap: Volume is normalized to a 0–100% scale and visually represented as candles below the chart.
Pine Script® float vol = volume / ta.percentile_nearest_rank(volume, 1000, 100) * 100 - Bar Coloring: Price candles are dynamically colored based on volume intensity.
Volume Divergence Logic:
- Bullish Divergence: Price forms a lower low, but volume forms a higher low.
- Bearish Divergence: Price forms a higher high, but volume forms a lower high.
- Dynamic Detection Range: Customizable range ensures divergence signals are meaningful and not random.
- Volume Labels: Additional info on divergence bars shows both the actual volume and its normalized % score.
🔵 FEATURES
- Volume Heatmap Plot: Normalized volume values colored using a smooth gradient from aqua (low) to red (high).
- Price Bar Coloring: Candlesticks on the main chart adopt the same heatmap color based on volume.
- Divergence Detection:
Bullish divergence with label and low marker
Bearish divergence with label and high marker - Dual Divergence Labels:
On the volume plot: Direction (Bull/Bear), raw volume, and normalized %
On the price chart: Shape labels showing "Bull" or "Bear" at local highs/lows - Custom Inputs:
Divergence range (min & max), pivot detection distance (left/right)
Toggle to show/hide divergence labels, volume, and % text - Clear Bull/Bear Coloring: Fully customizable label and line colors for both bullish and bearish signals.
🔵 HOW TO USE
- Use the indicator as an overlay to monitor real-time volume strength using the heatmap color.
- Watch for divergence markers:
Bullish divergence: Candle shows higher volume while price makes a new low
Bearish divergence: Candle shows lower volume while price makes a new high - Use the volume info labels to verify the context of divergence:
Actual volume at divergence candle
Normalized % of that volume compared to past 1000 bars - Adjust pivot sensitivity using "Pivot Left" and "Pivot Right" to tune signal frequency and lag with a right pivot length.
- Use divergence zones as early warnings for potential reversals or trend shifts.
- Disable or customize labels in settings depending on your charting preferences.
🔵 CONCLUSION
Volume HeatMap Divergence [BigBeluga] merges heatmap-style volume visualization with intelligent divergence detection — giving traders a clean yet powerful edge. By revealing hidden disconnections between price and participation, it helps users spot exhaustion moves or hidden accumulation zones before the market reacts. Whether you’re a scalper, swing trader, or intraday strategist, this tool offers real-time clarity on who’s in control behind the candles.
Mã nguồn mở
Theo đúng tinh thần TradingView, tác giả của tập lệnh này đã công bố nó dưới dạng mã nguồn mở, để các nhà giao dịch có thể xem xét và xác minh chức năng. Chúc mừng tác giả! Mặc dù bạn có thể sử dụng miễn phí, hãy nhớ rằng việc công bố lại mã phải tuân theo Nội quy.
🔵Gain access to our powerful tools : bigbeluga.com/tv
🔵Join our free discord for updates : bigbeluga.com/discord
All scripts & content provided by BigBeluga are for informational & educational purposes only.
🔵Join our free discord for updates : bigbeluga.com/discord
All scripts & content provided by BigBeluga are for informational & educational purposes only.
Thông báo miễn trừ trách nhiệm
Thông tin và các ấn phẩm này không nhằm mục đích, và không cấu thành, lời khuyên hoặc khuyến nghị về tài chính, đầu tư, giao dịch hay các loại khác do TradingView cung cấp hoặc xác nhận. Đọc thêm tại Điều khoản Sử dụng.