OPEN-SOURCE SCRIPT
Cập nhật Candles Based On Traded Volume
CBTV - Candlesticks Based on Traded Volume

This is the first robust implementation of volume based candlesticks (bars) on TradingView. This type of bar was describe in the book "Advances in Financial Machine Learning," written by Lopez de Prado, a well-known quant who has managed billions of dollars over the course of his career.
Volume Candlesticks (Bars) are bars that are indexed by total volume, with each set of N shares exchanged forming a separate bar.
This means that on CBTV chart a candle forms not after a specific time interval defined by the time frame of the chart, but when a determined volume was traded.
This approach to price sampling is much better than the time based one, because it does not oversample periods where nothing happens. Traditional candlestick charts show a lot of low volume bars without meaningful price changes in them.
The efficient price sampling results in better results when using volume based bars in machine learning forecasting models. They are also useful for technical analysis. Candlestick patterns on CBTV chart are more pronounced and have more predictive power.
Volume based bars can be constructed only for instruments where volume data is available. These are stocks, futures and crypto currencies.
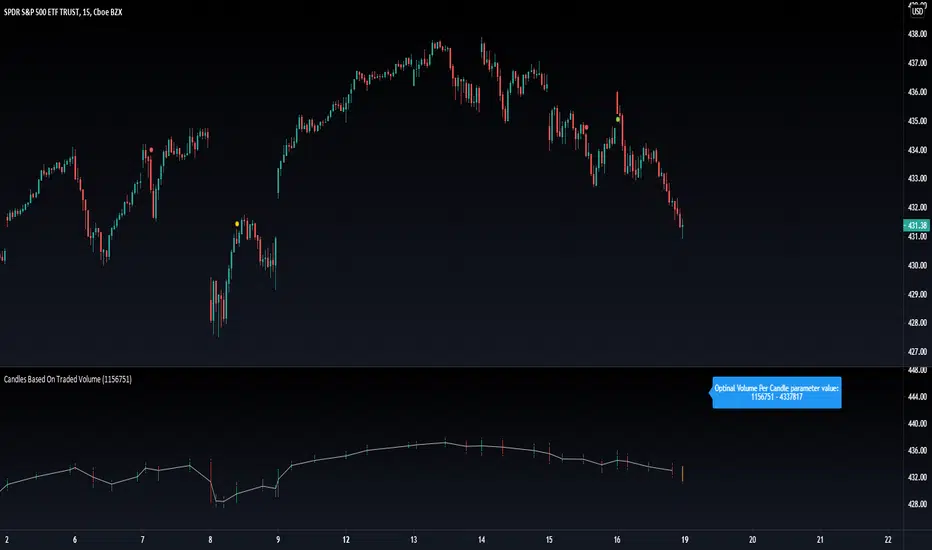
When you run CBTV it appears in a separate window below the traditional time based chart.
CBTV will be used in pair with a helper indicator which is called Optimal Volume per Candle (OVPC).
When applied to a chart OVPC shows the optimal range for volume per candle to construct volume based candlesticks from this timeframe data. It appears in the blue box above the most recent candle of a standard time based chart.
When you set a Volume Per Candle parameter in CBTV make sure it is within the range that shows OVPC. In this case volume based chart will be easy to read and all the calculations will be performed with the high level of precision.
The most recent unfinished candle is marked with the different set of colors than historical candles. Unfinished candle is colored in orange if it is a falling candle, blue it it is a rising one.

If you leave the CBTV chart opened for a long time you can have multiple blue or orange candles on it. In this case press the “hide” icon with the eye sign twice (it’s on the left side of the indicator panel next to its input parameters). This will refresh the CBTV and remove the artifacts.
While everything comes Real-time you will see the orange or blue bars form but never update. All you need to do is REFRESH THE CHART. Hoping soon to update this with a version you wont have to refresh the chart.
Please drop a like and comment what you guys think and once again thank you Tradingview for such a great platform :)
This is the first robust implementation of volume based candlesticks (bars) on TradingView. This type of bar was describe in the book "Advances in Financial Machine Learning," written by Lopez de Prado, a well-known quant who has managed billions of dollars over the course of his career.
Volume Candlesticks (Bars) are bars that are indexed by total volume, with each set of N shares exchanged forming a separate bar.
This means that on CBTV chart a candle forms not after a specific time interval defined by the time frame of the chart, but when a determined volume was traded.
This approach to price sampling is much better than the time based one, because it does not oversample periods where nothing happens. Traditional candlestick charts show a lot of low volume bars without meaningful price changes in them.
The efficient price sampling results in better results when using volume based bars in machine learning forecasting models. They are also useful for technical analysis. Candlestick patterns on CBTV chart are more pronounced and have more predictive power.
Volume based bars can be constructed only for instruments where volume data is available. These are stocks, futures and crypto currencies.
When you run CBTV it appears in a separate window below the traditional time based chart.
CBTV will be used in pair with a helper indicator which is called Optimal Volume per Candle (OVPC).
When applied to a chart OVPC shows the optimal range for volume per candle to construct volume based candlesticks from this timeframe data. It appears in the blue box above the most recent candle of a standard time based chart.
When you set a Volume Per Candle parameter in CBTV make sure it is within the range that shows OVPC. In this case volume based chart will be easy to read and all the calculations will be performed with the high level of precision.
The most recent unfinished candle is marked with the different set of colors than historical candles. Unfinished candle is colored in orange if it is a falling candle, blue it it is a rising one.
If you leave the CBTV chart opened for a long time you can have multiple blue or orange candles on it. In this case press the “hide” icon with the eye sign twice (it’s on the left side of the indicator panel next to its input parameters). This will refresh the CBTV and remove the artifacts.
While everything comes Real-time you will see the orange or blue bars form but never update. All you need to do is REFRESH THE CHART. Hoping soon to update this with a version you wont have to refresh the chart.
Please drop a like and comment what you guys think and once again thank you Tradingview for such a great platform :)
Phát hành các Ghi chú
-Fix BugsMã nguồn mở
Theo đúng tinh thần TradingView, tác giả của tập lệnh này đã công bố nó dưới dạng mã nguồn mở, để các nhà giao dịch có thể xem xét và xác minh chức năng. Chúc mừng tác giả! Mặc dù bạn có thể sử dụng miễn phí, hãy nhớ rằng việc công bố lại mã phải tuân theo Nội quy.
Access our exclusive tools at: angelalgo.com
Join our community via discord.gg/FGUTfkmYbW
All content from AngelAlgo is for informational and educational purposes only. Please note that past performance does not guarantee future results.
Join our community via discord.gg/FGUTfkmYbW
All content from AngelAlgo is for informational and educational purposes only. Please note that past performance does not guarantee future results.
Thông báo miễn trừ trách nhiệm
Thông tin và các ấn phẩm này không nhằm mục đích, và không cấu thành, lời khuyên hoặc khuyến nghị về tài chính, đầu tư, giao dịch hay các loại khác do TradingView cung cấp hoặc xác nhận. Đọc thêm tại Điều khoản Sử dụng.
Mã nguồn mở
Theo đúng tinh thần TradingView, tác giả của tập lệnh này đã công bố nó dưới dạng mã nguồn mở, để các nhà giao dịch có thể xem xét và xác minh chức năng. Chúc mừng tác giả! Mặc dù bạn có thể sử dụng miễn phí, hãy nhớ rằng việc công bố lại mã phải tuân theo Nội quy.
Access our exclusive tools at: angelalgo.com
Join our community via discord.gg/FGUTfkmYbW
All content from AngelAlgo is for informational and educational purposes only. Please note that past performance does not guarantee future results.
Join our community via discord.gg/FGUTfkmYbW
All content from AngelAlgo is for informational and educational purposes only. Please note that past performance does not guarantee future results.
Thông báo miễn trừ trách nhiệm
Thông tin và các ấn phẩm này không nhằm mục đích, và không cấu thành, lời khuyên hoặc khuyến nghị về tài chính, đầu tư, giao dịch hay các loại khác do TradingView cung cấp hoặc xác nhận. Đọc thêm tại Điều khoản Sử dụng.