PROTECTED SOURCE SCRIPT
Cập nhật 4-EMA Trend

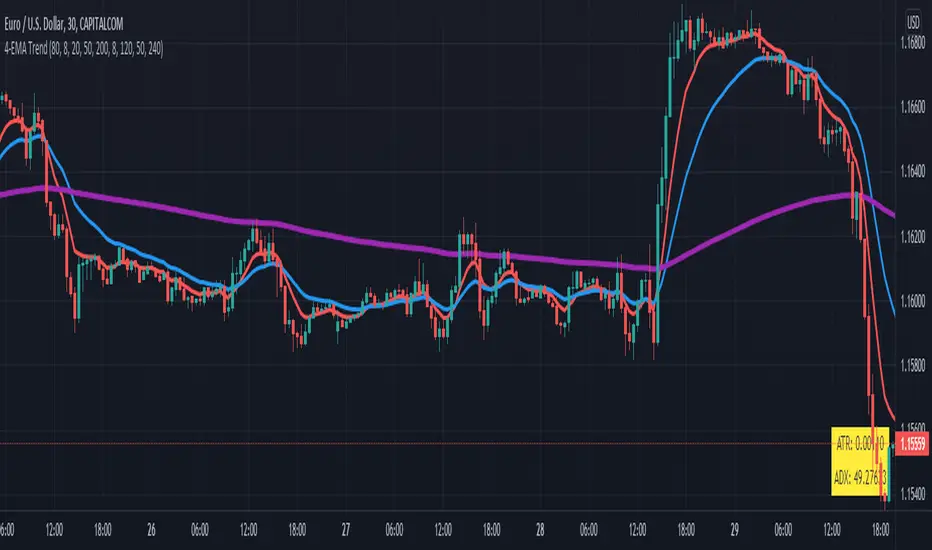
This indicator can be used to visualize when price is above or below special exponential moving averages (8, 21, 50 and 200) that are also displayed on the chart. A green or red background is plotted then, that can be followed as a trend. You can define the amount of risk (e.g. in $) and the number of previous bars that will be used to calculate the stop loss. For the stop loss a label is shown (long or short) that displays the quantity to buy or sell for your defined risk. It is recommend to use the indicator in combination with my Stochastic & RSI (see chart) to enter trades long or short when stochastic is overbought or oversold and RSI above or below 50.
 US100
US100
Phát hành các Ghi chú
Update trend indication: ema8 has to be above / below slower emaPhát hành các Ghi chú
EMA description and length adjustedPhát hành các Ghi chú
Show stop loss buy or sell depending price above or below slowest EMAPhát hành các Ghi chú
SMA 40 added as special pullback indicatorPhát hành các Ghi chú
Added alerts for long or short trend changePhát hành các Ghi chú
Add MTF support for slow EMAsPhát hành các Ghi chú
SMA replaced by EMA for trend detectionPhát hành các Ghi chú
Length of EMAs can be setPhát hành các Ghi chú
MTF EMA not displayed by default, 20, 50, 200 ema default lengthPhát hành các Ghi chú
ATR Stop added as dots (bullish, bearish)Phát hành các Ghi chú
Input option for ema fast and middle lengthPhát hành các Ghi chú
EMA Ribbon added with option to hide itPhát hành các Ghi chú
Alert when price is close to trend EMA (default 200 EMA)Phát hành các Ghi chú
Performance improved, ema ribbon removedPhát hành các Ghi chú
TEMA for trend includedPhát hành các Ghi chú
TEMA with custom length, pine version 5Phát hành các Ghi chú
Refactoring and 4th ema addedPhát hành các Ghi chú
ATR stoploss multiplier addedPhát hành các Ghi chú
Added real price display for Heikin Ashi chart typePhát hành các Ghi chú
Labels for engulfing candles addedPhát hành các Ghi chú
Engulfing pattern bug fixedPhát hành các Ghi chú
Barcolor for engulfing addedPhát hành các Ghi chú
Engulging candles added and atr to 10Phát hành các Ghi chú
Volatility Stop Length addedPhát hành các Ghi chú
Inside bar added as candlestick patternPhát hành các Ghi chú
Inside bar without colorMã được bảo vệ
Tập lệnh này được đăng dưới dạng mã nguồn đóng. Tuy nhiên, bạn có thể sử dụng tự do và không giới hạn – tìm hiểu thêm tại đây.
Access our indicators from: indivisionx.com
Thông báo miễn trừ trách nhiệm
Thông tin và các ấn phẩm này không nhằm mục đích, và không cấu thành, lời khuyên hoặc khuyến nghị về tài chính, đầu tư, giao dịch hay các loại khác do TradingView cung cấp hoặc xác nhận. Đọc thêm tại Điều khoản Sử dụng.
Mã được bảo vệ
Tập lệnh này được đăng dưới dạng mã nguồn đóng. Tuy nhiên, bạn có thể sử dụng tự do và không giới hạn – tìm hiểu thêm tại đây.
Access our indicators from: indivisionx.com
Thông báo miễn trừ trách nhiệm
Thông tin và các ấn phẩm này không nhằm mục đích, và không cấu thành, lời khuyên hoặc khuyến nghị về tài chính, đầu tư, giao dịch hay các loại khác do TradingView cung cấp hoặc xác nhận. Đọc thêm tại Điều khoản Sử dụng.