PROTECTED SOURCE SCRIPT
Cập nhật [blackcat] L3 Trendline LTF
Level: 3
Background
Trendlines are easily recognizable lines that traders draw on charts to connect a series of prices together or show some data's best fit. The resulting line is then used to give the trader a good idea of the direction in which an investment's value might move. A trendline is a line drawn over pivot highs or under pivot lows to show the prevailing direction of price. Trendlines are a visual representation of support and resistance in any time frame. They show direction and speed of price, and also describe patterns during periods of price contraction.
Function
This is a noval low time frame (LTF) trendline which was inquired from TradingView community. "How to draw a trendline in lower time frame based on higher time frame trend? "
1. Trendlines indicate the best fit of some data using a single line or curve.
2. A single trendline can be applied to a chart to give a clearer picture of the trend.
3. Trendlines can be applied to the highs and the lows to create a channel.
4. The time period being analyzed and the exact points used to create a trendline vary from trader to trader.
Remarks
Free but closed sourced.
The drawing may fail if your current resolution is already in large time frame.
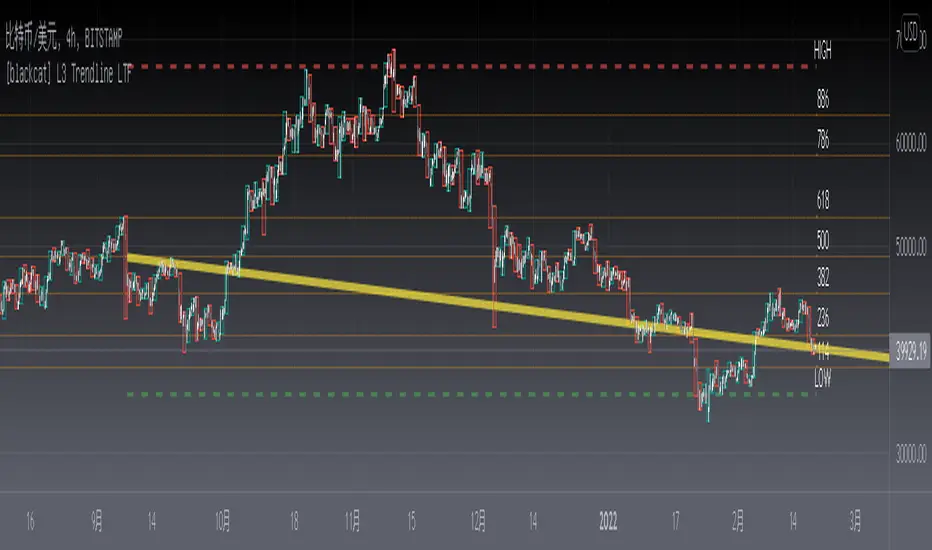
If the trendline is not drawn but you can see the red resistance and green support dashed lines, please drag the the chart to the left unitl you see the yellow solid trend line appears.
Background
Trendlines are easily recognizable lines that traders draw on charts to connect a series of prices together or show some data's best fit. The resulting line is then used to give the trader a good idea of the direction in which an investment's value might move. A trendline is a line drawn over pivot highs or under pivot lows to show the prevailing direction of price. Trendlines are a visual representation of support and resistance in any time frame. They show direction and speed of price, and also describe patterns during periods of price contraction.
Function
This is a noval low time frame (LTF) trendline which was inquired from TradingView community. "How to draw a trendline in lower time frame based on higher time frame trend? "
1. Trendlines indicate the best fit of some data using a single line or curve.
2. A single trendline can be applied to a chart to give a clearer picture of the trend.
3. Trendlines can be applied to the highs and the lows to create a channel.
4. The time period being analyzed and the exact points used to create a trendline vary from trader to trader.
Remarks
Free but closed sourced.
The drawing may fail if your current resolution is already in large time frame.
If the trendline is not drawn but you can see the red resistance and green support dashed lines, please drag the the chart to the left unitl you see the yellow solid trend line appears.
Phát hành các Ghi chú
Add powerful Fibonacci levels as wellPhát hành các Ghi chú
Adjust Fibo level linewith for better viewPhát hành các Ghi chú
correct backbars default valueMã được bảo vệ
Tập lệnh này được đăng dưới dạng mã nguồn đóng. Tuy nhiên, bạn có thể sử dụng tự do và không giới hạn – tìm hiểu thêm tại đây.
Avoid losing contact!Don't miss out! The first and most important thing to do is to join my Discord chat now! Click here to start your adventure: discord.com/invite/ZTGpQJq 防止失联,请立即行动,加入本猫聊天群: discord.com/invite/ZTGpQJq
Thông báo miễn trừ trách nhiệm
Thông tin và các ấn phẩm này không nhằm mục đích, và không cấu thành, lời khuyên hoặc khuyến nghị về tài chính, đầu tư, giao dịch hay các loại khác do TradingView cung cấp hoặc xác nhận. Đọc thêm tại Điều khoản Sử dụng.
Mã được bảo vệ
Tập lệnh này được đăng dưới dạng mã nguồn đóng. Tuy nhiên, bạn có thể sử dụng tự do và không giới hạn – tìm hiểu thêm tại đây.
Avoid losing contact!Don't miss out! The first and most important thing to do is to join my Discord chat now! Click here to start your adventure: discord.com/invite/ZTGpQJq 防止失联,请立即行动,加入本猫聊天群: discord.com/invite/ZTGpQJq
Thông báo miễn trừ trách nhiệm
Thông tin và các ấn phẩm này không nhằm mục đích, và không cấu thành, lời khuyên hoặc khuyến nghị về tài chính, đầu tư, giao dịch hay các loại khác do TradingView cung cấp hoặc xác nhận. Đọc thêm tại Điều khoản Sử dụng.