OPEN-SOURCE SCRIPT
Cập nhật Stochastic RSI Bands
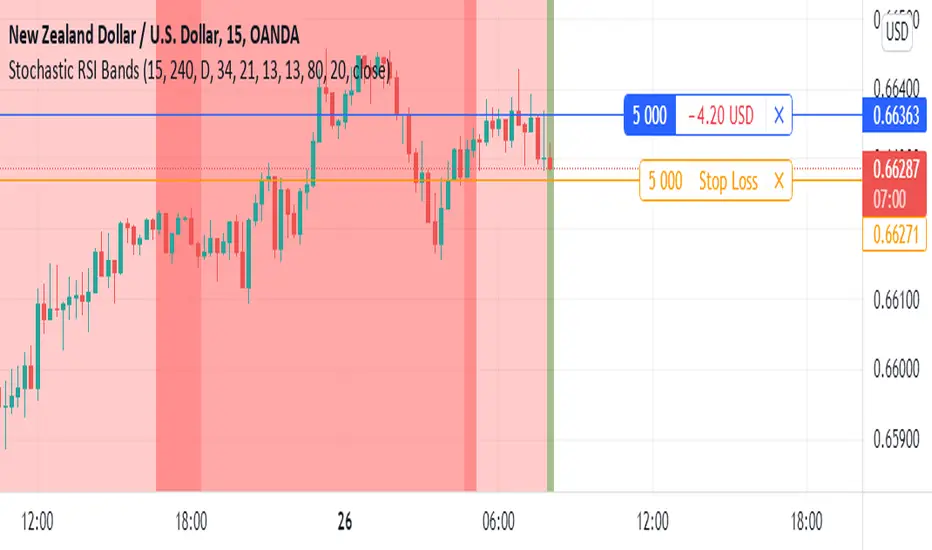
Stochastic RSI Bands by // © drbarry92064859
It is suggested to view this indicator on 15m or 5m timeframe with current Default Settings.
This indicator is based on the StochRsi.
It creates color bands based on the direction of multiple timeframe StochRsi.
When the MTF StochRsi's are opposed in direction it produces darker bands and when aligned in direction it produces light bands.
During Green Bands, price tends to be Bullish. During Red Bands, price tends to be Bearish.
During Medium toned Bands, price action tends to be in a correction in existing HTF trend, ranging, or getting ready for reversal.
During Light Bands, price tends to be in Trend in direction of color.
There is usually Dark Bands on either side of a light or medium toned band.
Best to enter in direction of current color, during the dark band after the medium toned bands
And exit in the dark band after the light toned band.
Brown bands tend to indicate reversal of direction and color.
I have experimented with all the timeframes and StochRSI settings and found the best settings to be as follows.
The Default settings are Middle Time Frame: 4H and Higher TimeFrame: D1.
The Default StochRSI settings are 34 RSI, 21 Stochastic, 13 smooth K and 13 smooth D.
It is suggested to use a lower timeframe such as 15m or 5m for entry.
You can experiment with different StochRSI and TimeFrame Settings.
SUGGESTED STRATEGY
Dark Bands after medium toned bands: Look for an entry on lower timeframe (15m or 5m) based on reversal candlestick formations or other indicators in direction of current color.
Light Bands: Do not enter during lighter bands. You should already be in trade during Light Bands
Light Band changes to Dark Band: Exit Trade if already in.
Look for general change of directional bias if a brown band occurs; however wait for dark band after the 2nd wide band following the brown band.
Phát hành các Ghi chú
Stochastic RSI Bands by // © drbarry92064859It is suggested to view this indicator on 15m or 5m timeframe with current Default Settings.
This indicator is based on the StochRsi.
It creates color bands based on the direction of multiple timeframe StochRsi.
When the MTF StochRsi's are opposed in direction it produces darker bands and when aligned in direction it produces light bands.
During Green Bands, price tends to be Bullish . During Red Bands, price tends to be Bearish .
During Medium toned Bands, price action tends to be in a correction in existing HTF trend, ranging, or getting ready for reversal.
During Light Bands, price tends to be in Trend in direction of color.
There is usually Dark Bands on either side of a light or medium toned band.
Best to enter in direction of current color, during the dark band after the medium toned bands
And exit in the dark band after the light toned band.
Brown bands tend to indicate reversal of direction and color.
I have experimented with all the timeframes and StochRSI settings and found the best settings to be as follows.
The Default settings are Middle Time Frame: 4H and Higher TimeFrame: D1.
The Default StochRSI settings are 34 RSI , 21 Stochastic , 13 smooth K and 13 smooth D.
It is suggested to use a lower timeframe such as 15m or 5m for entry.
You can experiment with different StochRSI and TimeFrame Settings.
SUGGESTED STRATEGY
Dark Bands after medium toned bands: Look for an entry on lower timeframe (15m or 5m) based on reversal candlestick formations or other indicators in direction of current color.
Light Bands: Do not enter during lighter bands. You should already be in trade during Light Bands
Light Band changes to Dark Band: Exit Trade if already in.
Look for general change of directional bias if a brown band occurs; however wait for dark band after the 2nd wide band following the brown band.
Mã nguồn mở
Theo đúng tinh thần TradingView, tác giả của tập lệnh này đã công bố nó dưới dạng mã nguồn mở, để các nhà giao dịch có thể xem xét và xác minh chức năng. Chúc mừng tác giả! Mặc dù bạn có thể sử dụng miễn phí, hãy nhớ rằng việc công bố lại mã phải tuân theo Nội quy.
Thông báo miễn trừ trách nhiệm
Thông tin và các ấn phẩm này không nhằm mục đích, và không cấu thành, lời khuyên hoặc khuyến nghị về tài chính, đầu tư, giao dịch hay các loại khác do TradingView cung cấp hoặc xác nhận. Đọc thêm tại Điều khoản Sử dụng.