OPEN-SOURCE SCRIPT
High Volume Zone Highlight

Description:
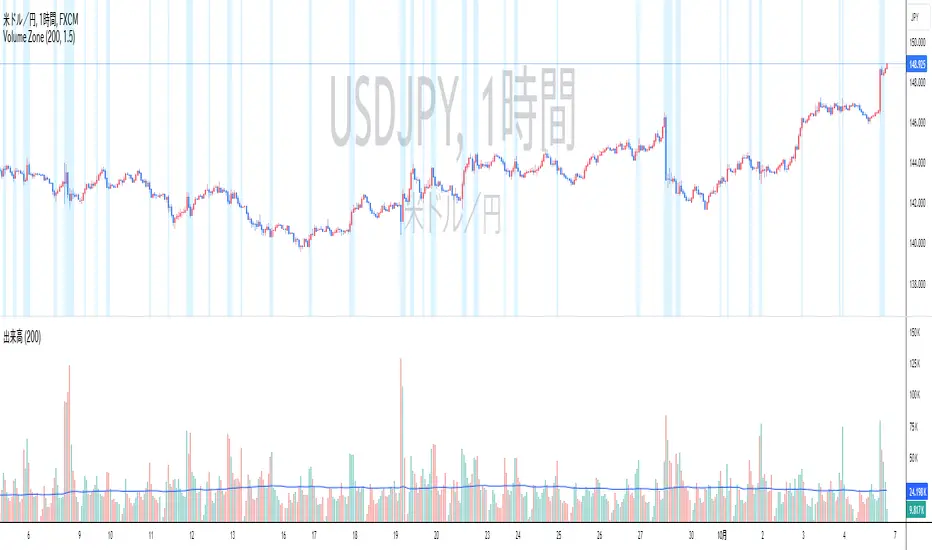
The High Volume Zone Highlight highlights areas on the chart where the volume exceeds a user-defined threshold based on a moving average. This helps traders visually identify zones of high trading activity.
Inputs:
Style Customization:
Users can adjust the color and transparency of the highlighted zones from the settings.
説明:
ハイ・ボリューム・ゾーン・ハイライトは、出来高が移動平均に基づいたユーザー定義の閾値を超えたエリアをチャート上で強調表示します。
設定項目:
スタイルカスタマイズ:
設定からハイライトされたゾーンの色や透明度を調整できます。
The High Volume Zone Highlight highlights areas on the chart where the volume exceeds a user-defined threshold based on a moving average. This helps traders visually identify zones of high trading activity.
- The moving average period and volume threshold are fully customizable.
- Background color highlights appear when the current volume is greater than a specified multiple of the volume moving average.
- Ideal for traders who want to spot significant volume changes relative to historical averages.
Inputs:
- Volume MA Length: The number of periods for calculating the volume moving average.
- Volume MA Factor: A multiplier to define the threshold. For example, setting this to 1.5 will highlight when the volume is 150% of the moving average.
Style Customization:
Users can adjust the color and transparency of the highlighted zones from the settings.
説明:
ハイ・ボリューム・ゾーン・ハイライトは、出来高が移動平均に基づいたユーザー定義の閾値を超えたエリアをチャート上で強調表示します。
- 移動平均期間と出来高閾値は自由にカスタマイズ可能です。
- 現在の出来高が出来高移動平均の指定した倍数を超えた場合、背景色が強調表示されます。
- 過去の平均と比較して重要な出来高の変化を検出したいトレーダーに最適です。
設定項目:
- 出来高移動平均期間:出来高移動平均を計算する際の期間。
- 出来高MA係数: 閾値を定義するための係数。たとえば、1.5に設定すると、出来高が移動平均の150%を超えたときにハイライトされます。
スタイルカスタマイズ:
設定からハイライトされたゾーンの色や透明度を調整できます。
Mã nguồn mở
Theo đúng tinh thần TradingView, tác giả của tập lệnh này đã công bố nó dưới dạng mã nguồn mở, để các nhà giao dịch có thể xem xét và xác minh chức năng. Chúc mừng tác giả! Mặc dù bạn có thể sử dụng miễn phí, hãy nhớ rằng việc công bố lại mã phải tuân theo Nội quy.
Thông báo miễn trừ trách nhiệm
Thông tin và các ấn phẩm này không nhằm mục đích, và không cấu thành, lời khuyên hoặc khuyến nghị về tài chính, đầu tư, giao dịch hay các loại khác do TradingView cung cấp hoặc xác nhận. Đọc thêm tại Điều khoản Sử dụng.