OPEN-SOURCE SCRIPT
Cập nhật ATR / Price Ratio
Description:
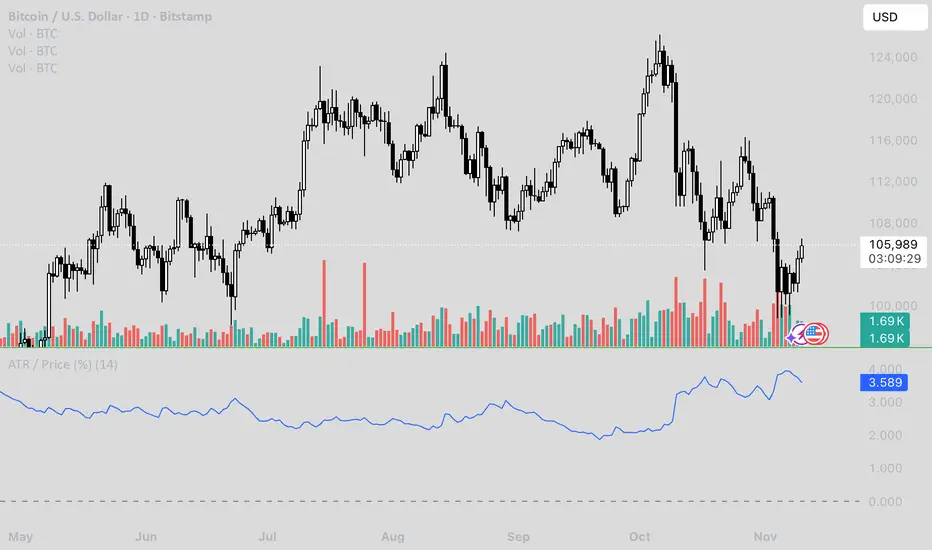
This indicator plots the ratio of the Average True Range (ATR) to the current price, showing volatility as a percentage of price rather than in absolute terms. It helps compare volatility across assets and timeframes by normalizing for price level.
A higher ATR/Price ratio means the market is moving a larger percentage of its value each bar (high relative volatility). A lower ratio indicates tighter, quieter price action (low relative volatility).
Traders can use this ratio to:
• Compare volatility between instruments
• Identify shifts into high or low volatility regimes
• Adjust position sizing and stop distances relative to risk
Phát hành các Ghi chú
Description:This indicator plots the ratio of the Average True Range (ATR) to the current price, showing volatility as a percentage of price rather than in absolute terms. It helps compare volatility across assets and timeframes by normalizing for price level.
A higher ATR/Price ratio means the market is moving a larger percentage of its value each bar (high relative volatility). A lower ratio indicates tighter, quieter price action (low relative volatility).
Traders can use this ratio to:
• Compare volatility between instruments
• Identify shifts into high or low volatility regimes
• Adjust position sizing and stop distances relative to risk
Mã nguồn mở
Theo đúng tinh thần TradingView, tác giả của tập lệnh này đã công bố nó dưới dạng mã nguồn mở, để các nhà giao dịch có thể xem xét và xác minh chức năng. Chúc mừng tác giả! Mặc dù bạn có thể sử dụng miễn phí, hãy nhớ rằng việc công bố lại mã phải tuân theo Nội quy.
Thông báo miễn trừ trách nhiệm
Thông tin và các ấn phẩm này không nhằm mục đích, và không cấu thành, lời khuyên hoặc khuyến nghị về tài chính, đầu tư, giao dịch hay các loại khác do TradingView cung cấp hoặc xác nhận. Đọc thêm tại Điều khoản Sử dụng.