PROTECTED SOURCE SCRIPT
Scott’s ATR volatility histogram with smoothing
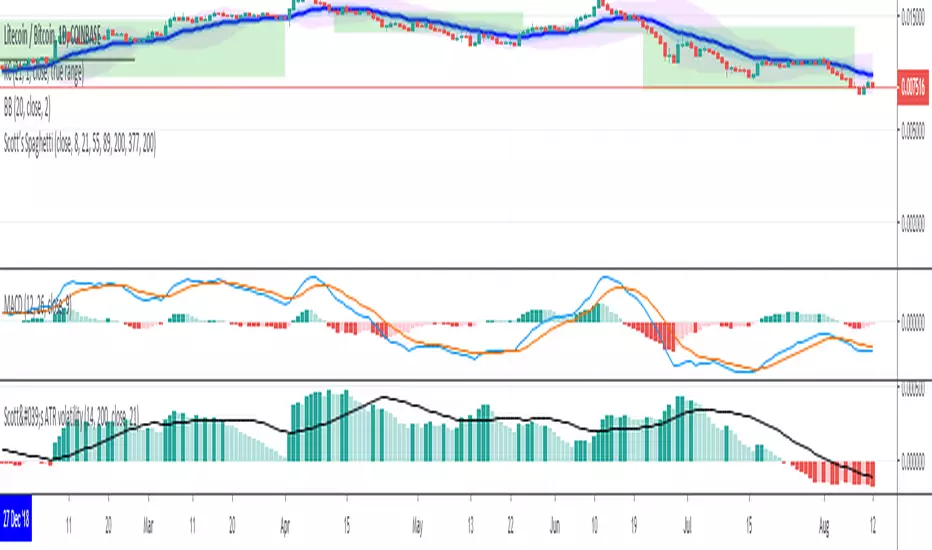
ATR shows volatility. The sma of the ATR gives a base line for whether volatility is increasing or decreasing. When ATR passes below the sma, the histogram goes red and shows that volatility is lower than the average volatilty over the last 200 (default) periods. The sma represents the zero line. I have added a 'smoothing' sma to the histogram values because it will help as a trade entry filter.... "Is the current volatility expansion (or contraction) momentum increasing or decreasing at this time" When the histogram value is above the smoothing line, volatility expansion momentum is increasing: a confirmation that the buy signal (derived from another indicator) is valid. Volatility expansion momentum also serves as a valid short entry confirmation. Volatility contraction momentum conversely tells one that a trend is not developing.
Mã được bảo vệ
Tập lệnh này được đăng dưới dạng mã nguồn đóng. Tuy nhiên, bạn có thể sử dụng tự do và không giới hạn – tìm hiểu thêm tại đây.
Thông báo miễn trừ trách nhiệm
Thông tin và các ấn phẩm này không nhằm mục đích, và không cấu thành, lời khuyên hoặc khuyến nghị về tài chính, đầu tư, giao dịch hay các loại khác do TradingView cung cấp hoặc xác nhận. Đọc thêm tại Điều khoản Sử dụng.