OPEN-SOURCE SCRIPT
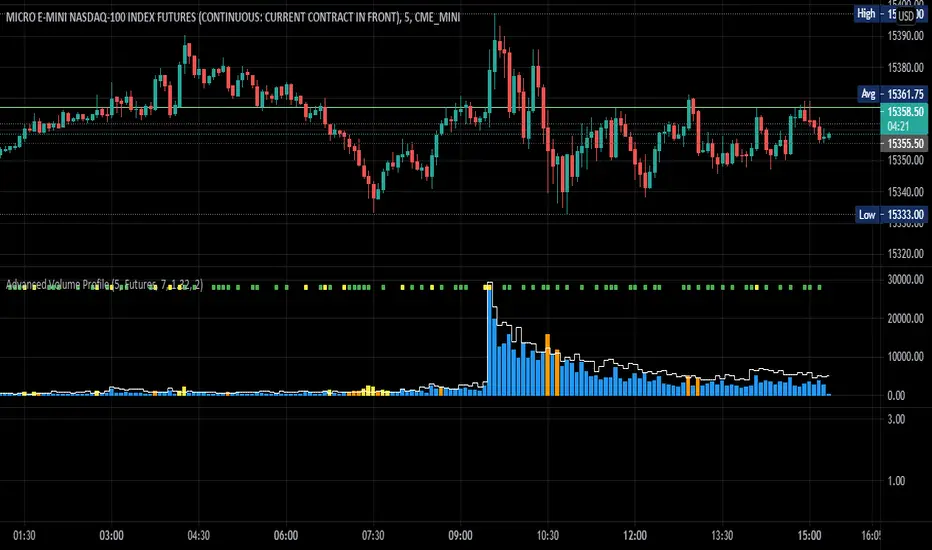
Advanced Volume Profile
THIS SCRIPT CURRENTLY ONLY WORKS FOR ASSETS THAT TRADE 24/7 OR CBOE FUTURES HOURS!
This script plots volume relative to an asset's historical volume profile.
Usage:
As a companion to my "Unusual Time Frame Volume" (UTF Volume) script, this plots volume against the same historical volume profile used for UTF Volume.
The same high volume (relative to historical) threshold alert is available (yellow bar).
Likewise, if the volume exceeds the historical threshold, but is below the alert threshold, the bar color is orange.
At the top of the chart is an indicator which is green if a bar has higher volume than the previous bar.
You can also set a threshold for this such that if the volume of a bar exceeds the previous bar by a certain multiplier which will turn the indicator yellow.
For example, if the threshold is set to "1.5", then the indicator will be yellow (instead of green) on an increase in volume over the previous bar of 1.5x.
NOTES:
Again, this script currently only works for assets that trade 24/7 or CBOE Futures hours!
Make sure you set the "Asset Mode" and "Time Frame (minutes)" to values that match your asset and chart setting.
For example, if you are trading Futures on a 2m chart, set the Asset Mode to Futures and Time Frame to 2m.
If you are trading crypto on a 5m chart, set the Asset Mode to 24/7 and Time Frame to 5m.
If the settings are not set appropriately, the output will be incorrect/invalid.
If you choose a "Look-back (Days)" setting that is too far back given the time frame, the script will produce an error.
I suggest playing with settings from "1" (compares volume to the previous day's volume) to the highest number that doesn't break the script.
For example, at a 2m time frame, the maximum look-back will be "6" or "7" depending on which mode you are using.
Longer chart time settings allow larger look-back values.
I find that the default value ("6") does a decent job in general.
Please feel free to reuse or further develop this script.
I would greatly appreciate it if you would send me a message below if you find it useful.
Mã nguồn mở
Theo đúng tinh thần TradingView, tác giả của tập lệnh này đã công bố nó dưới dạng mã nguồn mở, để các nhà giao dịch có thể xem xét và xác minh chức năng. Chúc mừng tác giả! Mặc dù bạn có thể sử dụng miễn phí, hãy nhớ rằng việc công bố lại mã phải tuân theo Nội quy.
Thông báo miễn trừ trách nhiệm
Thông tin và các ấn phẩm này không nhằm mục đích, và không cấu thành, lời khuyên hoặc khuyến nghị về tài chính, đầu tư, giao dịch hay các loại khác do TradingView cung cấp hoặc xác nhận. Đọc thêm tại Điều khoản Sử dụng.