OPEN-SOURCE SCRIPT
Cập nhật Exponential Action Map (EAM)
### **Exponential Action Map (EAM) – Description and Differences from VPVR**
The Exponential Action Map (EAM) indicator is a Pine Script-based volume profile indicator that offers **a weighted representation of buying and selling activity**. Unlike the standard **Volume Profile Visible Range (VPVR)**, which simply shows traded volume at various price levels, the EAM provides the following additional features:
1. **Exponential Weighting**:
- Instead of treating the volume of all considered bars equally, the EAM uses a **decay factor** to gradually diminish the significance of older data. This allows **more recent price movements to have greater influence**, making it particularly useful for short-term analysis.
2. **Exponential Stealth Move (ESM)**:
- In addition to buy and sell volume, the EAM calculates and displays the **Exponential Stealth Move (ESM)**.
- This measures the relative price movement compared to volume and highlights areas where **significant price changes occur with low volume**, which may indicate institutional activity or strong momentum.
- The ESM visualization is not present in VPVR, making it a distinct and valuable feature.
3. **Visualization Methodology**:
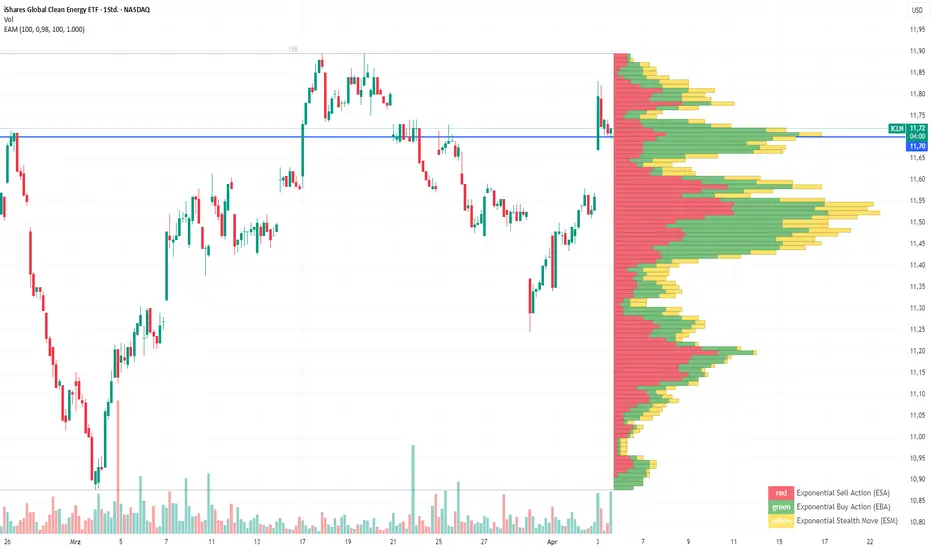
- Instead of simple histograms like in VPVR, volume is represented by **dynamic boxes** that encompass Buy (EBA), Sell (ESA), and Stealth Move (ESM) activities.
- The size and color of these boxes are **customizable**, allowing for clear differentiation between various volume types.
4. **Flexibility & Configuration**:
- Users can adjust parameters such as **Number of Bars, Decay Factor, Bar Width, and Maximum History Data**.
- The ability to **toggle historical data visibility** offers a **tailored view** that VPVR does not provide.
**Conclusion:** The EAM extends the classic volume profile (VPVR) by introducing **time-weighted volume analysis and detection of Stealth Moves (ESM)**. This not only highlights price levels with high trading volume but also reveals **price movements with low liquidity**, which can potentially indicate institutional interest.
The Exponential Action Map (EAM) indicator is a Pine Script-based volume profile indicator that offers **a weighted representation of buying and selling activity**. Unlike the standard **Volume Profile Visible Range (VPVR)**, which simply shows traded volume at various price levels, the EAM provides the following additional features:
1. **Exponential Weighting**:
- Instead of treating the volume of all considered bars equally, the EAM uses a **decay factor** to gradually diminish the significance of older data. This allows **more recent price movements to have greater influence**, making it particularly useful for short-term analysis.
2. **Exponential Stealth Move (ESM)**:
- In addition to buy and sell volume, the EAM calculates and displays the **Exponential Stealth Move (ESM)**.
- This measures the relative price movement compared to volume and highlights areas where **significant price changes occur with low volume**, which may indicate institutional activity or strong momentum.
- The ESM visualization is not present in VPVR, making it a distinct and valuable feature.
3. **Visualization Methodology**:
- Instead of simple histograms like in VPVR, volume is represented by **dynamic boxes** that encompass Buy (EBA), Sell (ESA), and Stealth Move (ESM) activities.
- The size and color of these boxes are **customizable**, allowing for clear differentiation between various volume types.
4. **Flexibility & Configuration**:
- Users can adjust parameters such as **Number of Bars, Decay Factor, Bar Width, and Maximum History Data**.
- The ability to **toggle historical data visibility** offers a **tailored view** that VPVR does not provide.
**Conclusion:** The EAM extends the classic volume profile (VPVR) by introducing **time-weighted volume analysis and detection of Stealth Moves (ESM)**. This not only highlights price levels with high trading volume but also reveals **price movements with low liquidity**, which can potentially indicate institutional interest.
Phát hành các Ghi chú
Exponential Action Map (EAM) IndicatorThe Exponential Action Map (EAM) is a powerful Pine Script indicator designed to visualize market activity by creating an exponential representation of buying and selling forces over a specified historical range. Unlike the Volume Profile Visible Range (VPVR), which only highlights price levels where trading volume is highest, the EAM also incorporates a unique component called the Exponential Stealth Move (ESM). This addition allows traders to identify and assess stealthy market movements that are not directly reflected by volume alone.
Key Features of EAM:
- Tracks historical price activity over a configurable number of bars.
- Applies an exponential decay factor to give more weight to recent data.
- Divides the price range into multiple buckets to provide granular insights.
- Visualizes Exponential Buy Actions (EBA), Exponential Sell Actions (ESA), and the Exponential Stealth Move (ESM).
- Allows customization of decay factors, bucket counts, colors, and other visual elements.
How EAM Differs from VPVR:
- While VPVR focuses solely on volume concentration at various price levels, EAM goes beyond by including the Exponential Stealth Move (ESM), which detects stealthy movements characterized by significant price changes with low volume activity.
- EAM applies exponential decay to historical data, prioritizing recent market activity, whereas VPVR provides a static view of volume over a visible range.
- EAM allows traders to track not only volume-based buying and selling actions but also detect hidden momentum shifts through the ESM metric.
Practical Use Cases:
- Identifying stealthy market accumulations or distributions that are not visible through traditional volume profile analysis.
- Detecting hidden buying or selling interest before significant price moves occur.
- Analyzing momentum shifts by observing changes in the ESM value relative to buy and sell actions.
The Exponential Action Map (EAM) is a sophisticated tool for traders seeking deeper insights into market dynamics, particularly in scenarios where conventional volume profile tools like VPVR may overlook critical but subtle market activity.
Phát hành các Ghi chú
Minor changes in input.Phát hành các Ghi chú
- Loop fix.
- Consider gaps when calculating stealth movement.
Phát hành các Ghi chú
- Optimized calculation (moved code to function)
Phát hành các Ghi chú
- Added legend for bars
- Minor calculation optimization
Mã nguồn mở
Theo đúng tinh thần TradingView, tác giả của tập lệnh này đã công bố nó dưới dạng mã nguồn mở, để các nhà giao dịch có thể xem xét và xác minh chức năng. Chúc mừng tác giả! Mặc dù bạn có thể sử dụng miễn phí, hãy nhớ rằng việc công bố lại mã phải tuân theo Nội quy.
Thông báo miễn trừ trách nhiệm
Thông tin và các ấn phẩm này không nhằm mục đích, và không cấu thành, lời khuyên hoặc khuyến nghị về tài chính, đầu tư, giao dịch hay các loại khác do TradingView cung cấp hoặc xác nhận. Đọc thêm tại Điều khoản Sử dụng.