OPEN-SOURCE SCRIPT
Accumulation/Distribution
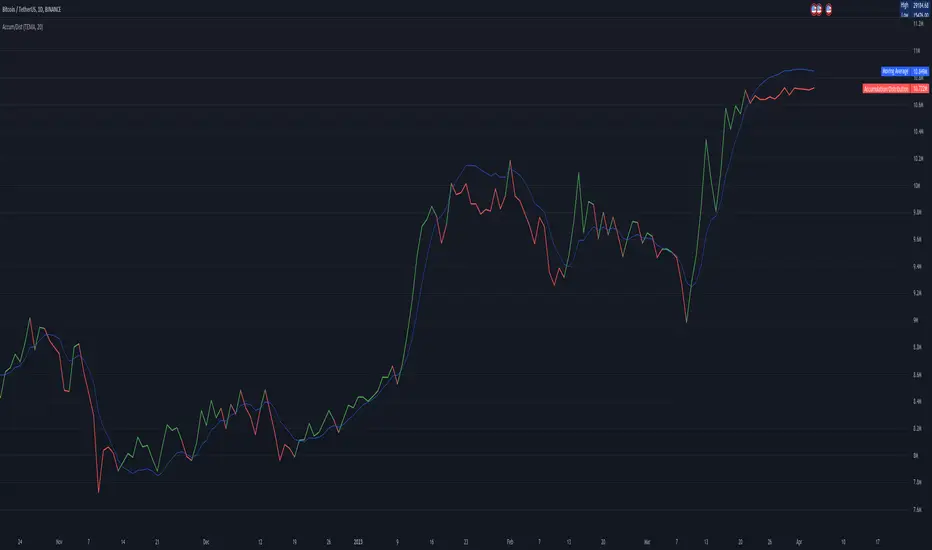
Accumulation/Distribution explains when the big players buy or sell, according to Wyckoff.
I added some colors to make it more visibly, to get a hint when (not) to invest.
A/D is a lagging indicator.
When the MA is above A/D line, this should reflect distribution time, and big players are selling.
The oppsite is when MA is below the A/D line, then this should be an accumulation phase, and big players are buying.
For example, my preference is a TEMA20 for crypto, this gives me good results.
But I added a bunch of moving averages to choose from.
Depending on preferences/marked you can choose a moving average, set its length, and you can choose all the colors too.
I recommend the Volume indicator to setup the MA line, and this will get much better results!

I hope this script will help some people to do some better decisions.
And I am pleased to get some advice to make this script even better!
There is only one similar-sounding script in the public section.
Kudos go to jbneto with his Accum/ Dist + 200 EMA which gave me the inspiration.
It has a EMA200, and its focus is on the daily pivot price.
I added some colors to make it more visibly, to get a hint when (not) to invest.
A/D is a lagging indicator.
When the MA is above A/D line, this should reflect distribution time, and big players are selling.
The oppsite is when MA is below the A/D line, then this should be an accumulation phase, and big players are buying.
For example, my preference is a TEMA20 for crypto, this gives me good results.
But I added a bunch of moving averages to choose from.
Depending on preferences/marked you can choose a moving average, set its length, and you can choose all the colors too.
I recommend the Volume indicator to setup the MA line, and this will get much better results!
I hope this script will help some people to do some better decisions.
And I am pleased to get some advice to make this script even better!
There is only one similar-sounding script in the public section.
Kudos go to jbneto with his Accum/ Dist + 200 EMA which gave me the inspiration.
It has a EMA200, and its focus is on the daily pivot price.
Mã nguồn mở
Theo đúng tinh thần TradingView, tác giả của tập lệnh này đã công bố nó dưới dạng mã nguồn mở, để các nhà giao dịch có thể xem xét và xác minh chức năng. Chúc mừng tác giả! Mặc dù bạn có thể sử dụng miễn phí, hãy nhớ rằng việc công bố lại mã phải tuân theo Nội quy.
Thông báo miễn trừ trách nhiệm
Thông tin và các ấn phẩm này không nhằm mục đích, và không cấu thành, lời khuyên hoặc khuyến nghị về tài chính, đầu tư, giao dịch hay các loại khác do TradingView cung cấp hoặc xác nhận. Đọc thêm tại Điều khoản Sử dụng.