OPEN-SOURCE SCRIPT
Cập nhật Adaptive Parabolic SAR (PSAR) [Loxx]
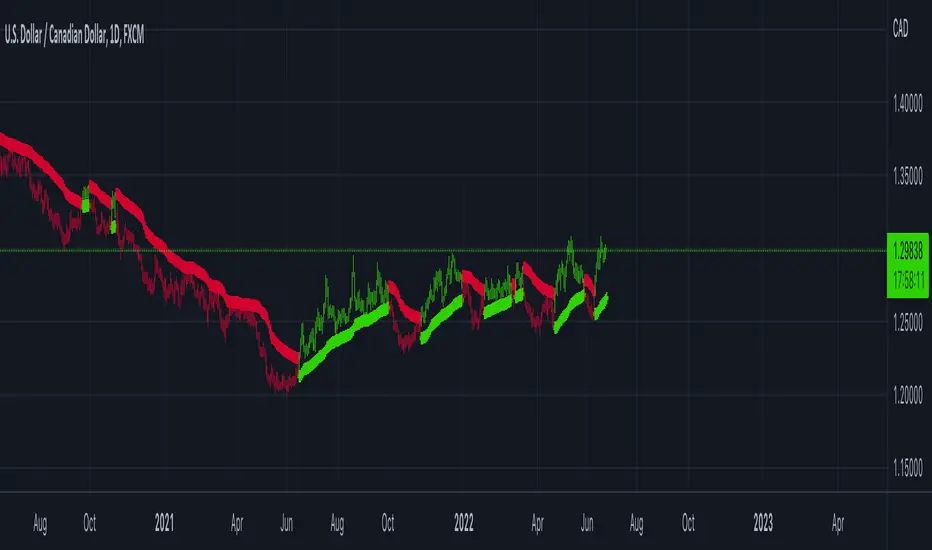
Adaptive Parabolic SAR (PSAR) [Loxx] is an advanced Parabolic SAR with adaptive adjustments using either a Kaufman or an Ehlers smoothing algorithms.
What is the Parabolic SAR?
The parabolic SAR attempts to give traders an edge by highlighting the direction an asset is moving, as well as providing entry and exit points. In this article, we'll look at the basics of this indicator and show you how you can incorporate it into your trading strategy. We'll also look at some of the drawbacks of the indicator.
The parabolic SAR is a technical indicator used to determine the price direction of an asset, as well as draw attention to when the price direction is changing. Sometimes known as the "stop and reversal system," the parabolic SAR was developed by J. Welles Wilder Jr., creator of the relative strength index (RSI).1
On a chart, the indicator appears as a series of dots placed either above or below the price bars. A dot below the price is deemed to be a bullish signal. Conversely, a dot above the price is used to illustrate that the bears are in control and that the momentum is likely to remain downward. When the dots flip, it indicates that a potential change in price direction is under way. For example, if the dots are above the price, when they flip below the price, it could signal a further rise in price.
Additional Options
Enjoy!
What is the Parabolic SAR?
The parabolic SAR attempts to give traders an edge by highlighting the direction an asset is moving, as well as providing entry and exit points. In this article, we'll look at the basics of this indicator and show you how you can incorporate it into your trading strategy. We'll also look at some of the drawbacks of the indicator.
The parabolic SAR is a technical indicator used to determine the price direction of an asset, as well as draw attention to when the price direction is changing. Sometimes known as the "stop and reversal system," the parabolic SAR was developed by J. Welles Wilder Jr., creator of the relative strength index (RSI).1
On a chart, the indicator appears as a series of dots placed either above or below the price bars. A dot below the price is deemed to be a bullish signal. Conversely, a dot above the price is used to illustrate that the bears are in control and that the momentum is likely to remain downward. When the dots flip, it indicates that a potential change in price direction is under way. For example, if the dots are above the price, when they flip below the price, it could signal a further rise in price.
Additional Options
- Toggle signals on/off
- HiLo mode
- Kaufman adaptive, Ehlers adaptive, or non adaptive
- Filter by Pips
- Minimum Change by Pips
- Color bars
Enjoy!
Phát hành các Ghi chú
Updated pip cutoffs and filtersPhát hành các Ghi chú
Updated to handle JPY and other assets on pip filters.Mã nguồn mở
Theo đúng tinh thần TradingView, tác giả của tập lệnh này đã công bố nó dưới dạng mã nguồn mở, để các nhà giao dịch có thể xem xét và xác minh chức năng. Chúc mừng tác giả! Mặc dù bạn có thể sử dụng miễn phí, hãy nhớ rằng việc công bố lại mã phải tuân theo Nội Quy.
Public Telegram Group, t.me/algxtrading_public
VIP Membership Info: patreon.com/algxtrading/membership
VIP Membership Info: patreon.com/algxtrading/membership
Thông báo miễn trừ trách nhiệm
Thông tin và các ấn phẩm này không nhằm mục đích, và không cấu thành, lời khuyên hoặc khuyến nghị về tài chính, đầu tư, giao dịch hay các loại khác do TradingView cung cấp hoặc xác nhận. Đọc thêm tại Điều khoản Sử dụng.
Mã nguồn mở
Theo đúng tinh thần TradingView, tác giả của tập lệnh này đã công bố nó dưới dạng mã nguồn mở, để các nhà giao dịch có thể xem xét và xác minh chức năng. Chúc mừng tác giả! Mặc dù bạn có thể sử dụng miễn phí, hãy nhớ rằng việc công bố lại mã phải tuân theo Nội Quy.
Public Telegram Group, t.me/algxtrading_public
VIP Membership Info: patreon.com/algxtrading/membership
VIP Membership Info: patreon.com/algxtrading/membership
Thông báo miễn trừ trách nhiệm
Thông tin và các ấn phẩm này không nhằm mục đích, và không cấu thành, lời khuyên hoặc khuyến nghị về tài chính, đầu tư, giao dịch hay các loại khác do TradingView cung cấp hoặc xác nhận. Đọc thêm tại Điều khoản Sử dụng.