PROTECTED SOURCE SCRIPT
New Price Highs/Lows (plotted on RSI)
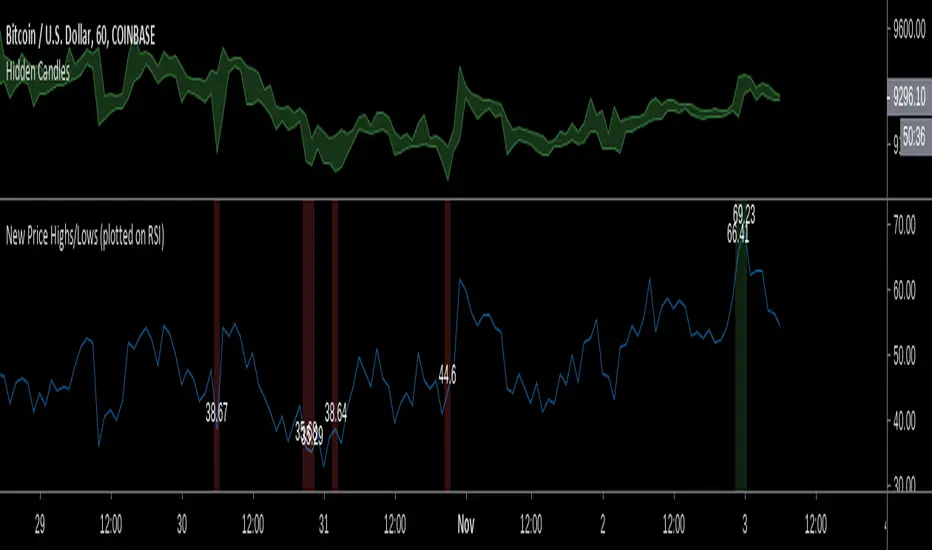
Rather than rely on existing indicators for bullish/bearish divergence, I'd rather just identify it myself.
This indicator just makes this easier to see (hands-free) the relevant data on the RSI at points where the price hits new highs/lows by colouring the background on the RSI based on price action and also plotting the RSI values at those points so you dont need to keep hovering over the RSI with your mouse.
Stay aware of your lookback setting because it will effect how often the new price highs/lows are highlighted.
Mã được bảo vệ
Tập lệnh này được đăng dưới dạng mã nguồn đóng. Tuy nhiên, bạn có thể tự do sử dụng tập lệnh mà không có bất kỳ hạn chế nào – tìm hiểu thêm tại đây.
Thông báo miễn trừ trách nhiệm
Thông tin và ấn phẩm không có nghĩa là và không cấu thành, tài chính, đầu tư, kinh doanh, hoặc các loại lời khuyên hoặc khuyến nghị khác được cung cấp hoặc xác nhận bởi TradingView. Đọc thêm trong Điều khoản sử dụng.