OPEN-SOURCE SCRIPT
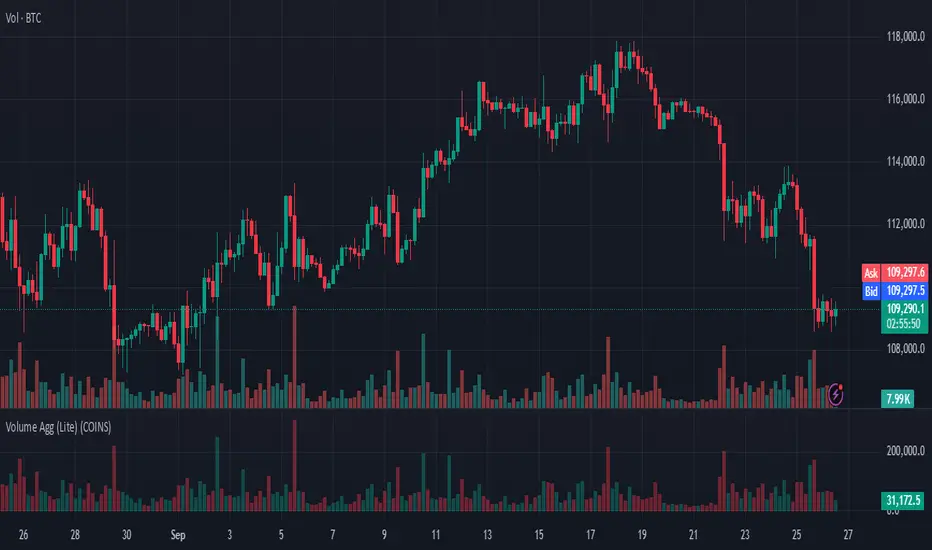
Volume Aggregated (Lite)

Volume Aggregated (Lite) is a lightweight yet powerful tool designed to provide traders with a consolidated view of trading volume across major perpetual futures markets. Instead of relying solely on the volume of a single exchange, this indicator aggregates and normalizes data from multiple venues, giving a broader and more representative measure of market activity.
Supported Exchanges:
Binance (USDT.P & USDC.P)
Bybit (USDT.P & USD.P)
OKX (USDT.P & USD.P)
Bitget (USDT.P & USD.P)
Coinbase (USDC.P)
Users can toggle each exchange individually, allowing flexible customization depending on which markets they consider most relevant.
Denomination Options:
COINS: Volume expressed in the base currency (e.g., BTC, ETH).
USD: Volume normalized to USD values by multiplying with price.
Why it’s useful:
Volume is a critical component of technical analysis, reflecting market participation and conviction behind price moves. However, relying on a single exchange can create blind spots, especially in crypto where liquidity is fragmented. By combining data from multiple large exchanges, this indicator offers:
A more comprehensive measure of market interest.
A normalized comparison between exchanges with different quote currencies (e.g., USDT, USD, USDC).
A volume stream that can be used as a custom source for other indicators, strategies, or overlays within TradingView.
Practical Applications:
Trend Confirmation: Check if aggregated volume supports price direction.
Breakout Validation: Identify whether breakouts are backed by broad participation across venues.
Divergence Detection: Spot situations where price moves without sufficient cross-exchange volume.
Custom Indicator Input: Since it outputs a clean series, it can be plugged into moving averages, oscillators, or custom-built scripts.
Technical Details:
The script uses request.security() to pull volume data across exchanges and normalizes values when required (e.g., USD-quoted pairs divided by the instrument’s price). It then aggregates all valid inputs into a single stream. The result is displayed as color-coded columns (green for bullish candles, red for bearish), making it easy to interpret at a glance.
This “Lite” version keeps the focus on core functionality: aggregation, normalization, and straightforward visualization—avoiding unnecessary complexity while remaining highly adaptable for custom analysis.
Mã nguồn mở
Theo đúng tinh thần TradingView, tác giả của tập lệnh này đã công bố nó dưới dạng mã nguồn mở, để các nhà giao dịch có thể xem xét và xác minh chức năng. Chúc mừng tác giả! Mặc dù bạn có thể sử dụng miễn phí, hãy nhớ rằng việc công bố lại mã phải tuân theo Nội quy.
Thông báo miễn trừ trách nhiệm
Thông tin và các ấn phẩm này không nhằm mục đích, và không cấu thành, lời khuyên hoặc khuyến nghị về tài chính, đầu tư, giao dịch hay các loại khác do TradingView cung cấp hoặc xác nhận. Đọc thêm tại Điều khoản Sử dụng.