PROTECTED SOURCE SCRIPT
Cập nhật NEoWave Chart

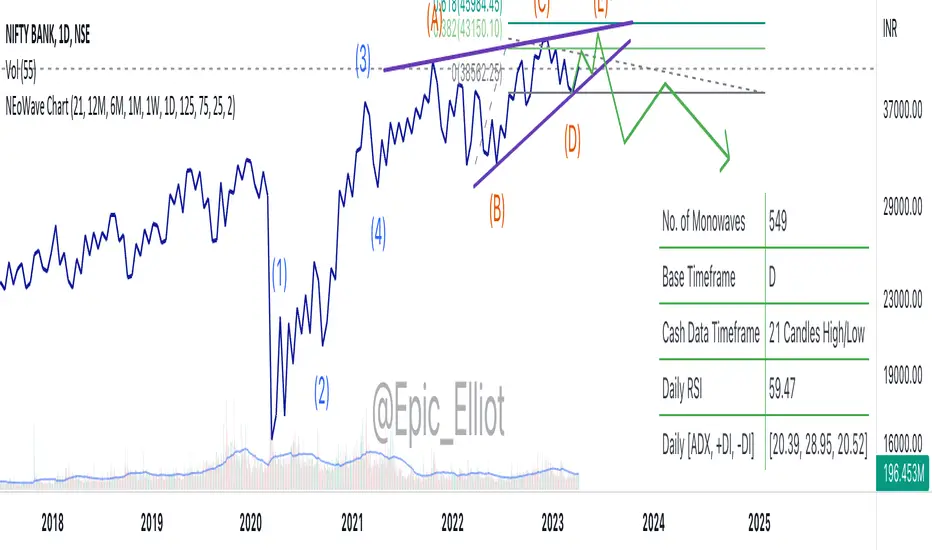
This is the indicator used to plot cash data chart for NEoWave analysis.
How to use:
How to use:
- Apply the indicator on the chart.
- Select timeframe on your chart.
- The indicator will automatically select default cash data timeframe and will plot chart accordingly. If you like to change the cash data timeframe, these is an option to select from dropdown.
Phát hành các Ghi chú
I have added various features in this update like, selecting cash data timeframe based on number of candles or in-build timeframe, updated table content. Though, cash data chart based on in-built timeframe will work on certain timeframes only, as other timeframes does not equally divide.Phát hành các Ghi chú
1 Cash data chart based on number of candles. Number of candles to be used for the chart may be selected from dropdown menu2 Cash data chart also available based on inbuilt timeframes, but limited to some specific timeframes only. Custom timeframe may be selected from dropdown menu.
3 Cash data timeframe divider included, may be selected/unselected in the menu.
4 First and last monowaves improved.
5 Candlestick chart also added. Transparency may be changed in the style menu.
Phát hành các Ghi chú
RSI and ADX values based on daily timeframe addedMã được bảo vệ
Tập lệnh này được đăng dưới dạng mã nguồn đóng. Tuy nhiên, bạn có thể sử dụng tự do và không giới hạn – tìm hiểu thêm tại đây.
Thông báo miễn trừ trách nhiệm
Thông tin và các ấn phẩm này không nhằm mục đích, và không cấu thành, lời khuyên hoặc khuyến nghị về tài chính, đầu tư, giao dịch hay các loại khác do TradingView cung cấp hoặc xác nhận. Đọc thêm tại Điều khoản Sử dụng.
Mã được bảo vệ
Tập lệnh này được đăng dưới dạng mã nguồn đóng. Tuy nhiên, bạn có thể sử dụng tự do và không giới hạn – tìm hiểu thêm tại đây.
Thông báo miễn trừ trách nhiệm
Thông tin và các ấn phẩm này không nhằm mục đích, và không cấu thành, lời khuyên hoặc khuyến nghị về tài chính, đầu tư, giao dịch hay các loại khác do TradingView cung cấp hoặc xác nhận. Đọc thêm tại Điều khoản Sử dụng.