PROTECTED SOURCE SCRIPT
9-Candle Pattern + Support & Resistance
9-Candle Pattern + Support & Resistance Indicator
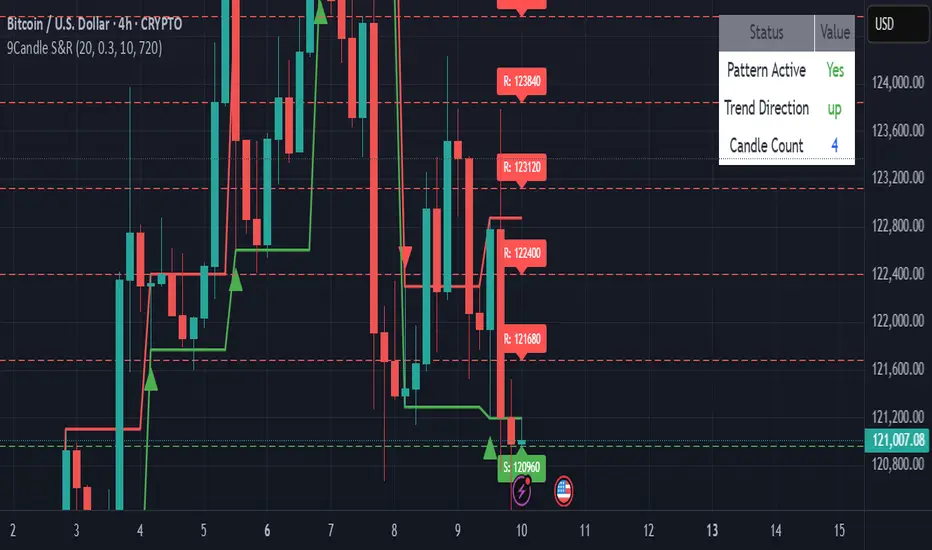
The 9-Candle Pattern + Support & Resistance indicator is a powerful technical analysis tool designed to identify short-term reversal patterns and key price levels on any chart. It combines candlestick pattern recognition with dynamic support and resistance zones, providing traders with actionable entry and exit signals.
Key Features
🔹 9-Candle Pattern Detection:
Automatically scans the chart for a 9-candle formation that often precedes potential trend reversals or breakout opportunities.
The pattern highlights price exhaustion zones where momentum is likely to shift.
🔹 Automatic Support & Resistance Levels:
Plots real-time support and resistance zones based on recent swing highs and lows, helping traders spot crucial decision points on the chart.
🔹 Multi-Timeframe Compatibility:
Works seamlessly across multiple timeframes, from intraday scalping to swing trading setups.
🔹 Custom Alerts:
Receive alerts when a valid 9-candle reversal pattern forms near a key support or resistance level — increasing the accuracy of trade confirmations.
🔹 Visual Clarity:
Clean visual cues for patterns and zones, making chart analysis intuitive without clutter.
How It Helps
This indicator simplifies technical analysis by merging price action logic with market structure awareness.
Traders can quickly identify:
Potential reversal zones
Breakout opportunities
High-probability entries aligned with strong S/R levels
Best For
Price action traders
Swing and intraday traders
Traders using confluence-based strategies
Mã được bảo vệ
Tập lệnh này được đăng dưới dạng mã nguồn đóng. Tuy nhiên, bạn có thể tự do sử dụng tập lệnh mà không có bất kỳ hạn chế nào – tìm hiểu thêm tại đây.
Thông báo miễn trừ trách nhiệm
Thông tin và ấn phẩm không có nghĩa là và không cấu thành, tài chính, đầu tư, kinh doanh, hoặc các loại lời khuyên hoặc khuyến nghị khác được cung cấp hoặc xác nhận bởi TradingView. Đọc thêm trong Điều khoản sử dụng.