OPEN-SOURCE SCRIPT
Automatic Fibonacci retracement based on the highest high and lo
The chart is fractal, meaning that what happens can always be broken down into smaller portions.
This is often seen in various AR (Algorithmic Rules) concepts, such as breakers, order blocks, etc., where the price reacts.
I’ve visualized this behavior with this indicator.
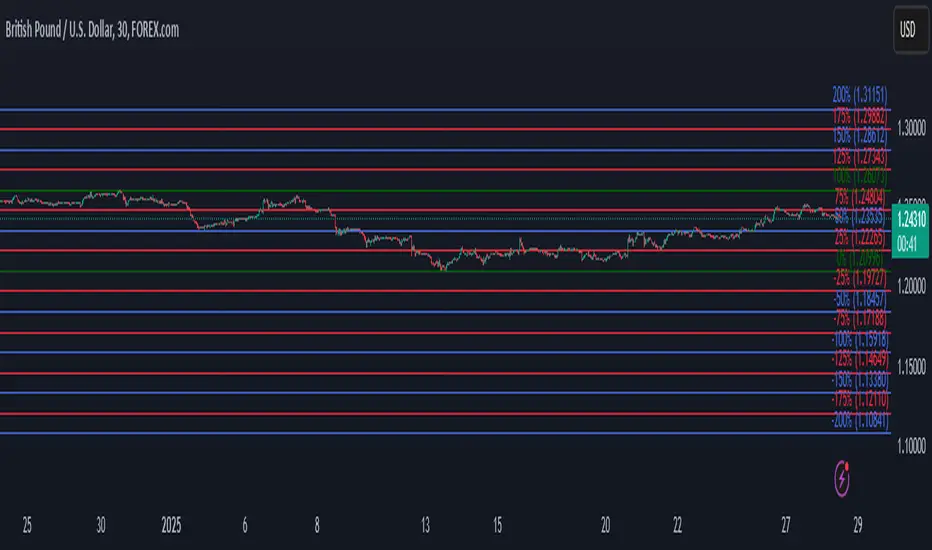
This indicator takes the highest high and the lowest low from the past 5 weeks, excluding the current week.
The lowest low will represent 0%, and the highest high will represent 100% (green lines).
It then divides this range into 25%, 50%, 75%, and 100% levels (red and blue lines).
The indicator works on all charts and all timeframes, automatically adjusting when you switch charts or timeframes. No manual input is required.
Additionally, above 100%, it will create levels at 125%, 150%, 175%, and 200%, while below 0%, it will create levels at -25%, -50%, -75%, and -100%.
Your chart will now be divided into these 25% levels, allowing you to observe how the price either respects or breaks through them.
Again, this isn’t something “groundbreaking,” but simply a visual aid to identify levels where the price finds support/resistance or breaks through.
It helps me gain a broader perspective and determine whether my trade is moving in the right direction or if I should remain cautious.
This is often seen in various AR (Algorithmic Rules) concepts, such as breakers, order blocks, etc., where the price reacts.
I’ve visualized this behavior with this indicator.
This indicator takes the highest high and the lowest low from the past 5 weeks, excluding the current week.
The lowest low will represent 0%, and the highest high will represent 100% (green lines).
It then divides this range into 25%, 50%, 75%, and 100% levels (red and blue lines).
The indicator works on all charts and all timeframes, automatically adjusting when you switch charts or timeframes. No manual input is required.
Additionally, above 100%, it will create levels at 125%, 150%, 175%, and 200%, while below 0%, it will create levels at -25%, -50%, -75%, and -100%.
Your chart will now be divided into these 25% levels, allowing you to observe how the price either respects or breaks through them.
Again, this isn’t something “groundbreaking,” but simply a visual aid to identify levels where the price finds support/resistance or breaks through.
It helps me gain a broader perspective and determine whether my trade is moving in the right direction or if I should remain cautious.
Mã nguồn mở
Theo đúng tinh thần TradingView, tác giả của tập lệnh này đã công bố nó dưới dạng mã nguồn mở, để các nhà giao dịch có thể xem xét và xác minh chức năng. Chúc mừng tác giả! Mặc dù bạn có thể sử dụng miễn phí, hãy nhớ rằng việc công bố lại mã phải tuân theo Nội quy.
Thông báo miễn trừ trách nhiệm
Thông tin và các ấn phẩm này không nhằm mục đích, và không cấu thành, lời khuyên hoặc khuyến nghị về tài chính, đầu tư, giao dịch hay các loại khác do TradingView cung cấp hoặc xác nhận. Đọc thêm tại Điều khoản Sử dụng.