tux

TUX Candles

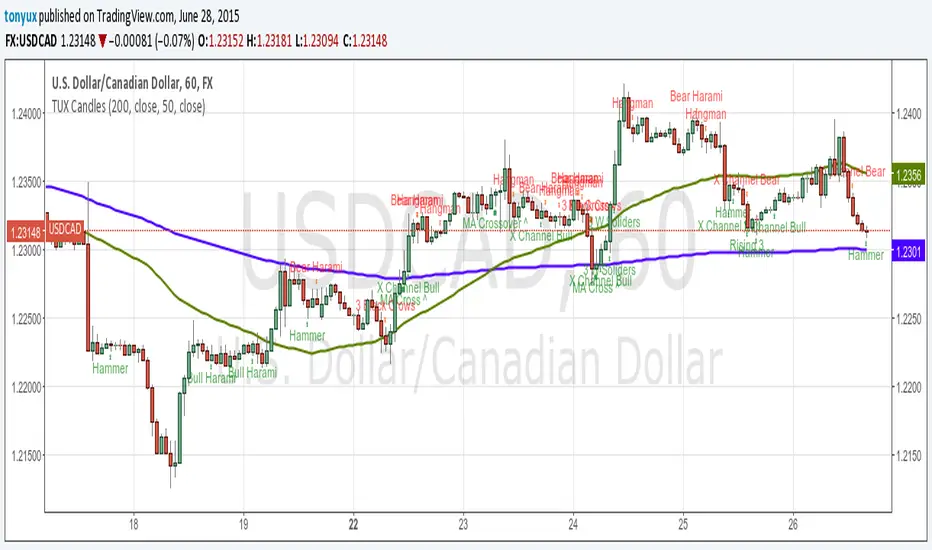
This indicator has a lot of information. This is the first version so stay tuned for updates, and please let me know of any bugs.

Candlestick Indicators:
Doji
Shooting Star
Evening Star
Hammer
Hanging Man

Candlestick Formations
Tri-star
Bearish Harami
Bullish Harami
Bearish Harami Cross
Bullish Harami Cross
Bullish Engulfing
Bearish Engulfing
Rising Three
Falling Three
Bearish Abandoned Baby
Bullish Abandoned Baby
Three Black Crows
Three White Soldiers

Technical Indicators:
(You can set you MA periods)
Moving Average Cross
Move Average Crossover
Mã nguồn mở

Với tinh thần TradingView, tác giả của tập lệnh này đã xuất bản nó dưới dạng mã nguồn mở, vì vậy các nhà giao dịch có thể hiểu và xác minh nó. Chúc mừng tác giả! Bạn có thể sử dụng mã này miễn phí, nhưng việc sử dụng lại mã này trong một ấn phẩm chịu sự điều chỉnh của Nội quy nội bộ. Bạn có thể yêu thích nó để sử dụng nó trên biểu đồ.

Thông báo miễn trừ trách nhiệm

Thông tin và ấn phẩm không có nghĩa là và không cấu thành, tài chính, đầu tư, kinh doanh, hoặc các loại lời khuyên hoặc khuyến nghị khác được cung cấp hoặc xác nhận bởi TradingView. Đọc thêm trong Điều khoản sử dụng.

Bạn muốn sử dụng tập lệnh này trên biểu đồ?
study(title="TUX Candles", shorttitle="TUX Candles", overlay=true)

//simple moving average high
len = input(200, minval=1, title="Simple Moving Average")
src = input(close, title="Source")
out = sma(src, len)
plot(out,color=blue,linewidth=2)

//simple moving average low
len1 = input(50, minval=1, title="Simple Moving Average")
src1 = input(close, title="Source")
out1 = sma(src1, len1)
plot(out1,color=olive,linewidth=2)

mabuy = cross(close,out) and close[1] < out
plotshape(mabuy, color=green, style=shape.flag, text="MA Cross ^", location=location.belowbar)
masell = cross(close,out) and close[1] > out
plotshape(masell, color=red, style=shape.flag, text="MA Cross -", location=location.abovebar)

macrossbuy = cross(out1,out) and out1[1] < out1
plotshape(macrossbuy, color=green, style=shape.flag, text="MA Crossover ^", location=location.belowbar)
macrosssell = cross(out1,out) and out1[1] > out1
plotshape(macrosssell, color=red, style=shape.flag, text="MA Crossover -", location=location.abovebar)


// Candlesticks
dojicandle = open == close
plotshape(dojicandle, color=blue, style=shape.diamond, text="Doji", location=location.belowbar)
dojibearish = open[1] == close[1] and close < close[1] 
plotshape(dojibearish, color=red, style=shape.arrowdown, text="Evening Star", location=location.abovebar)


shootingstar = out < close and open < high and open > close and close > low and close > close[1]
plotshape(shootingstar, color=red, style=shape.diamond, text="Shooting Star", location=location.abovebar)

thehammer =  close > hl2 and close < close[len1] and open > close
plotshape(thehammer, color=green, style=shape.arrowup, text="Hammer", location=location.belowbar)


hangman =  close > hl2 and close > close[len1] and open > close
plotshape(hangman, color=red, style=shape.arrowdown, text="Hangman", location=location.abovebar)


// Candlestick formations
tristar = open == close and open[1] == close[1] 
plotshape(tristar, color=blue, style=shape.diamond, text="Tristar", location=location.abovebar)

bearishharami = high[1] > high and low[1] < low and close < close[1] and open > open[1] and close > close[len1]
plotshape(bearishharami, color=red, style=shape.arrowdown, text="Bear Harami", location=location.abovebar)

bullishharami = high[1] < high and low[1] > low and close > close[1] and open < open[1] and close < close[len1]
plotshape(bullishharami, color=green, style=shape.arrowup, text="Bull Harami", location=location.belowbar)

bullharmcross = close[1] < close[2] and close == open and close < close[len1]
plotshape(bullharmcross, color=green, style=shape.arrowup, text="Bull Har Cross", location=location.belowbar)

bearharmcross = close[1] > close[2] and close == open and close > close[len1]
plotshape(bearharmcross, color=red, style=shape.arrowdown, text="Bear Har Cross", location=location.abovebar)


bullengulfing = close > open and close > close[1] and close > open[1] and open < open[1] and open < close[1] and open < low[1] and close > high[1]
plotshape(bullengulfing, color=green, style=shape.arrowup, text="Bull Engulfing", location=location.belowbar)


bearengulfing = close < open and close < close[1] and close < open[1] and open > open[1] and open > close[1] and open > low[1] and close < high[1]
plotshape(bearengulfing, color=red, style=shape.arrowdown, text="Bear Engulfing", location=location.abovebar)

risingthree = close[1] < close[2] and close[2] < close[3] and close[3] < close[4] and low[1] > low[5] and high[4] < high[5]
plotshape(risingthree, color=green, style=shape.arrowup, text="Rising 3", location=location.belowbar)

fallingthree = close[1] > close[2] and close[2] > close[3] and close[3] > close[4] and low[1] < low[5] and high[4] > high[5]
plotshape(fallingthree, color=red, style=shape.arrowdown, text="Falling 3", location=location.abovebar)

bearabandbaby = close[1] > close[2] and close[2] > close[3] and close[3] > close[4] and close == open
plotshape(bearabandbaby, color=red, style=shape.arrowdown, text="Bear Abd Baby", location=location.abovebar)

bullabandbaby = close[1] < close[2] and close[2] < close[3] and close[3] < close[4] and close == open
plotshape(bullabandbaby, color=green, style=shape.arrowup, text="Bull Abd Baby", location=location.belowbar)

threeblackcrows = close[1] < close[2] and close[2] < close[3] and close[3] < close[4] and high > low[1] and high[1] > low[2] and high[2] > low[3] and close[2] > out1 and close < out1
plotshape(threeblackcrows, color=red, style=shape.arrowdown, text="3 Black Crows", location=location.abovebar)

threewhitesoliders = close[1] > close[2] and close[2] > close[3] and close[3] > close[4] and low[1] < high[2] and low[2] < high[3] and low[3] < high[4] and close[2] < out1 and close > out1
plotshape(threewhitesoliders, color=green, style=shape.arrowup, text="3 W Soliders", location=location.belowbar)


// channel lines
//plot(high[len1],color=green)
//plot(low[len1],color=red)

crosschannelup = cross(high[len],close) and close > high[len] and close > close[1]
plotshape(crosschannelup, color=green, style=shape.arrowup, text="X Channel Bull", location=location.belowbar)

crosschanneldown = cross(low[len],close) and close < low[len] and close < close[1]
plotshape(crosschanneldown, color=red, style=shape.arrowdown, text="X Channel Bear", location=location.abovebar)