PROTECTED SOURCE SCRIPT
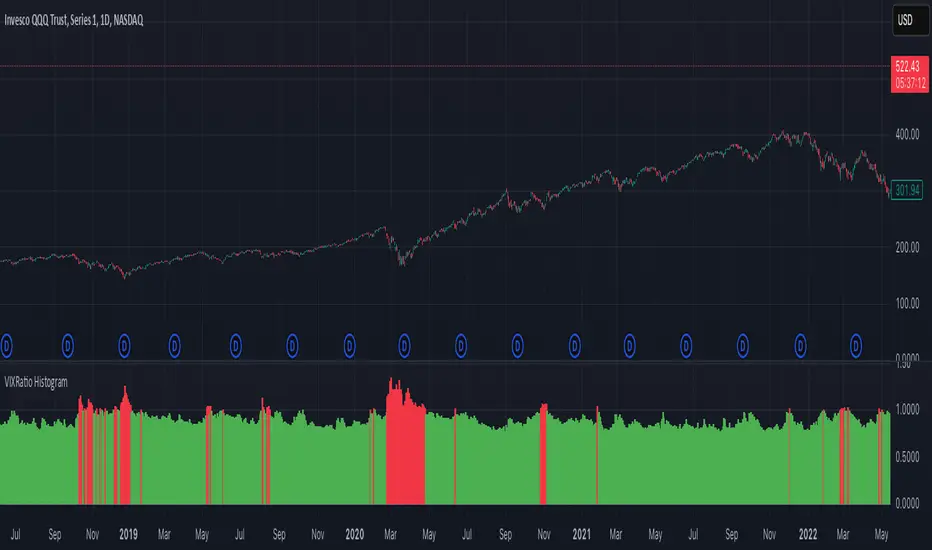
VIXRatio Histogram
VIX3M-VIX Difference Histogram Indicator
Overview
This indicator measures the difference between the 3-month VIX (VIX3M) and the standard 30-day VIX, displayed as a color-coded histogram. When the histogram is green, VIX3M exceeds VIX, indicating a normal term structure. When red, the term structure is inverted.
Market Timing Benefits
The VIX3M-VIX spread serves as a powerful market timing tool for daily chart analysis:
- Green Histogram (Positive Spread): Represents a normal volatility term structure where longer-dated volatility (VIX3M) is priced higher than short-term volatility (VIX). This typically occurs during relatively stable market conditions and signals potentially favorable environments for risk assets.
- Red Histogram (Negative Spread): Indicates volatility term structure inversion, where short-term volatility expectations exceed longer-term expectations. This pattern often emerges during market stress and can signal heightened risk aversion.
- Transition Points: The crossing of the histogram from positive to negative (or vice versa) frequently precedes significant market turning points, offering early warning signals for potential trend changes.
- Magnitude Awareness: The size of the histogram bars indicates the intensity of the relationship – larger green bars suggest strong market confidence, while deeper red bars may signal severe market distress.
Recommended Usage
For optimal results, use this indicator on the daily timeframe alongside trend analysis and other market breadth indicators. The VIXRatio relationship has historically provided valuable context for market conditions, helping traders adjust positioning before major market shifts materialize in price action.
To fully understand its power, please refer to this article on Substack
Mã được bảo vệ
Tập lệnh này được đăng dưới dạng mã nguồn đóng. Tuy nhiên, bạn có thể sử dụng tự do và không giới hạn – tìm hiểu thêm tại đây.
Thông báo miễn trừ trách nhiệm
Thông tin và các ấn phẩm này không nhằm mục đích, và không cấu thành, lời khuyên hoặc khuyến nghị về tài chính, đầu tư, giao dịch hay các loại khác do TradingView cung cấp hoặc xác nhận. Đọc thêm tại Điều khoản Sử dụng.