OPEN-SOURCE SCRIPT
CBG Key Numbers v6
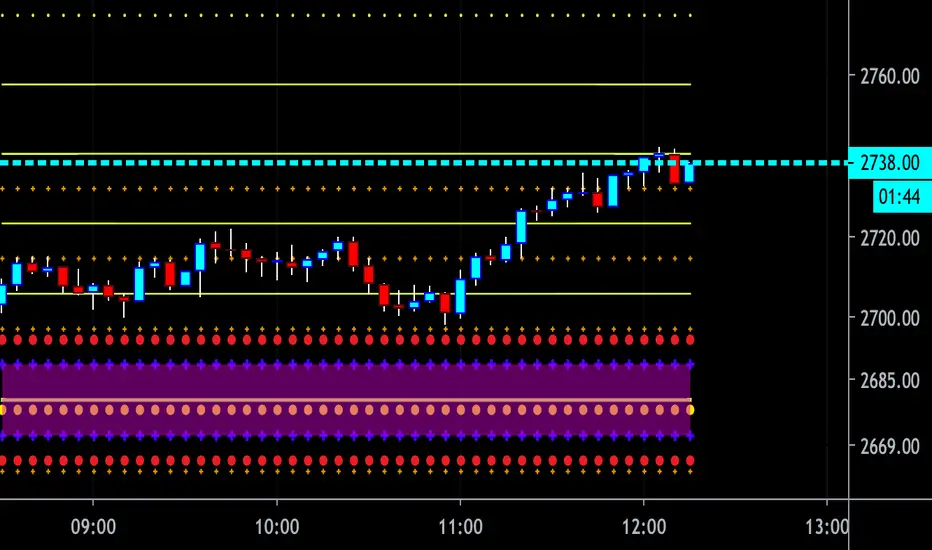
Here is my opening range, key numbers indicator. It takes the Opening Range (5 minutes by default) and then plots the opening range and up to 7 extensions of that range above and below.
It's amazing how the OR is stamped up on the rest of the day's price movements.
2 strategies (at least) are to play the OR range breakout and to fade when price hits an extreme range.
You have total control over how you set up the various lines and colors.
If you start overlaying the trading day with the OR and it's extensions, you will see amazing patterns become clear. For example, the pump and reverse. This is where price pumps right out of the opening and then reverses later in the morning.
I have the opening price set to big circles as this is one of the most important reference points during the day.
Important: For some reason, the 9:30 am time Opening acts differently for equities and futures . For equities, you can set the time values to 0930. But for futures , to capture the Open at 9:30, you have to set the time values to start at 0830. I haven't been able to find a better solution but setting the times manually works. Make sure to set all the time values on the Options screen.
There is one more setting of interest. It is called IB Target Amount. This is a number above and below the opening range that I have observed price to hit whenever there's a breakout. This will allow you to predict a price target on breakouts. For SPY , I have found that price usually breaks out to at least 50 cents. On ES futures , it's 6 dollars. This can help you lock in 10% and 20% when trading options and is a great tool. That's why I have it so prominent in red. You will also see price return to this level during the day and act as support or resistance.
Please disregard the red and green shaded rectangles. They are my own support and resistance zones and TV wouldn't let me hide them from the picture. :-)
I mostly use this on a 5 minute chart but any timeframe will work.
Mã nguồn mở
Theo đúng tinh thần TradingView, tác giả của tập lệnh này đã công bố nó dưới dạng mã nguồn mở, để các nhà giao dịch có thể xem xét và xác minh chức năng. Chúc mừng tác giả! Mặc dù bạn có thể sử dụng miễn phí, hãy nhớ rằng việc công bố lại mã phải tuân theo Nội quy.
Thông báo miễn trừ trách nhiệm
Thông tin và các ấn phẩm này không nhằm mục đích, và không cấu thành, lời khuyên hoặc khuyến nghị về tài chính, đầu tư, giao dịch hay các loại khác do TradingView cung cấp hoặc xác nhận. Đọc thêm tại Điều khoản Sử dụng.