OPEN-SOURCE SCRIPT
Swing High/Low (ZigZag) [ChartPrime]

Swing High/Low (ZigZag) Indicator [ChartPrime]
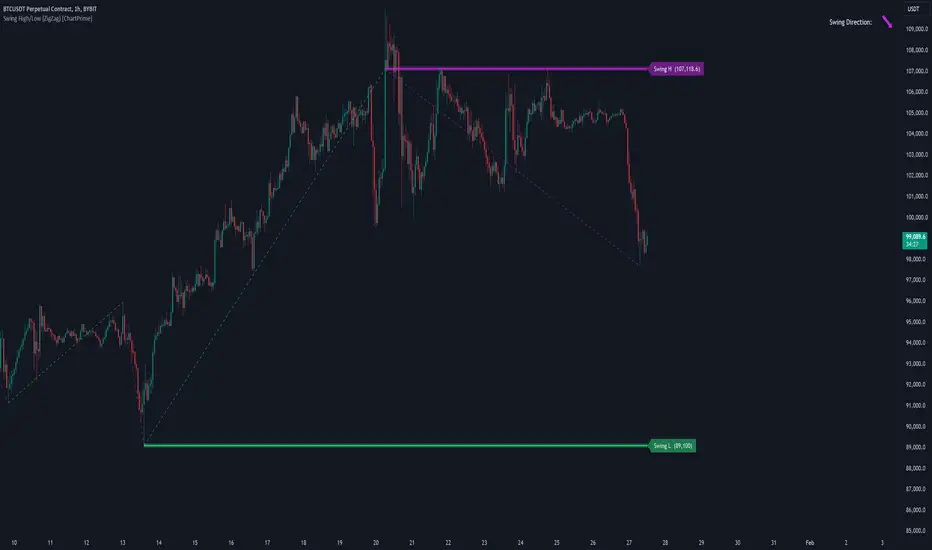
The Swing High/Low (ZigZag) Indicator [ChartPrime] is a versatile tool for identifying and visualizing price swings, swing highs, and swing lows. It dynamically plots levels for significant price points while connecting them with a ZigZag line, enabling traders to analyze market structure and trends with precision.
⯁ KEY FEATURES
⯁ HOW TO USE
⯁ CONCLUSION
The Swing High/Low (ZigZag) Indicator [ChartPrime] is a powerful tool for traders seeking to visualize price swings and market structure. Its real-time updates, customizable settings, and dynamic swing direction make it an invaluable resource for technical analysis and decision-making.
The Swing High/Low (ZigZag) Indicator [ChartPrime] is a versatile tool for identifying and visualizing price swings, swing highs, and swing lows. It dynamically plots levels for significant price points while connecting them with a ZigZag line, enabling traders to analyze market structure and trends with precision.
⯁ KEY FEATURES
- Swing Highs and Lows Detection
Accurately detects and marks swing highs and lows, providing a clear structure of market movements. - Real-Time ZigZag Line
Connects swing points with a dynamic ZigZag line for a visual representation of price trends. - Customizable Swing Sensitivity
Swing length input allows traders to adjust the sensitivity of swing detection to match their preferred market conditions. - Swing Levels with Shadows
Option to display swing levels with extended shadows for better visibility and market analysis. - Broken Levels Marking
Tracks and visually updates levels as dashed lines when broken, providing insights into shifts in market structure. - Swing Direction Display
At the top-right corner, the indicator displays the current swing direction (up or down) with a directional arrow for quick reference. - Interactive Labels
Marks swing levels with labels, showing the price of swing highs and lows for added clarity. - Dynamic Market Structure Analysis
Automatically adjusts ZigZag lines and levels as the market evolves, ensuring real-time updates for accurate trading decisions.
⯁ HOW TO USE
- Analyze Market Trends
Use the ZigZag line and swing levels to identify the overall direction and structure of the market. - Spot Significant Price Points
Swing highs and lows act as potential support and resistance levels for trading opportunities. - Adjust Swing Sensitivity
Modify the swing length setting to match your trading strategy, whether scalping, day trading, or swing trading. - Monitor Broken Levels
Use the dashed lines of broken levels to identify changes in market dynamics and potential breakout or breakdown zones. - Plan Entries and Exits
Leverage swing levels and direction to determine optimal entry, stop-loss, and take-profit points.
⯁ CONCLUSION
The Swing High/Low (ZigZag) Indicator [ChartPrime] is a powerful tool for traders seeking to visualize price swings and market structure. Its real-time updates, customizable settings, and dynamic swing direction make it an invaluable resource for technical analysis and decision-making.
Mã nguồn mở
Theo đúng tinh thần TradingView, tác giả của tập lệnh này đã công bố nó dưới dạng mã nguồn mở, để các nhà giao dịch có thể xem xét và xác minh chức năng. Chúc mừng tác giả! Mặc dù bạn có thể sử dụng miễn phí, hãy nhớ rằng việc công bố lại mã phải tuân theo Nội quy.
Thông báo miễn trừ trách nhiệm
Thông tin và các ấn phẩm này không nhằm mục đích, và không cấu thành, lời khuyên hoặc khuyến nghị về tài chính, đầu tư, giao dịch hay các loại khác do TradingView cung cấp hoặc xác nhận. Đọc thêm tại Điều khoản Sử dụng.