OPEN-SOURCE SCRIPT
Cập nhật Dynamic Rate of Change Oscillator
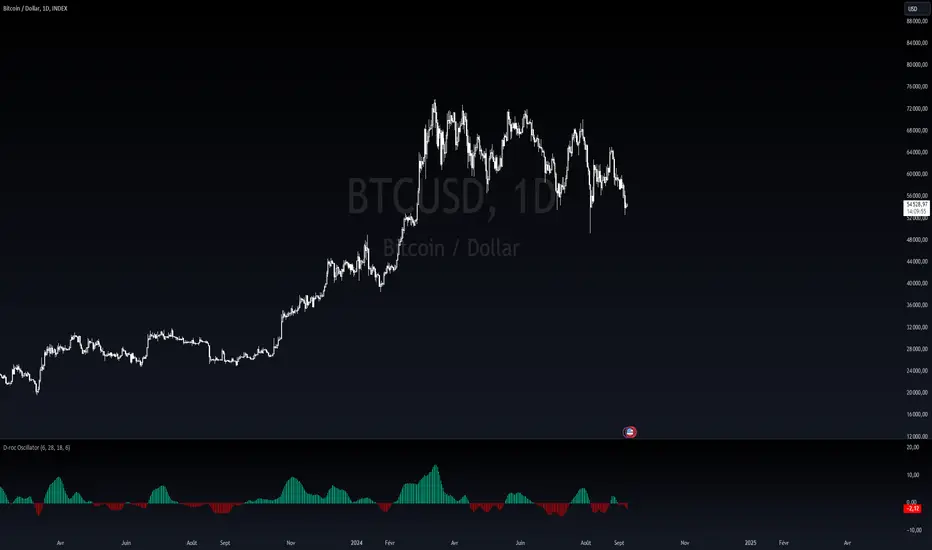
Dynamic Rate of Change (RoC) Oscillator with Color-Coded Histogram
Detailed Description for Publication
The Dynamic Rate of Change (RoC) Oscillator with Color-Coded Histogram is a sophisticated technical analysis tool designed to enhance your understanding of market momentum. Created using Pine Script v5 on the TradingView platform, this indicator integrates multiple Rate of Change (RoC) calculations into a unified momentum oscillator. The resulting data is displayed as a color-coded histogram, providing a clear visual representation of momentum changes.
Key Features and Functionality
Multi-Length RoC Calculation:
Short-term RoC: Calculated over a user-defined period (shortRoCLength), this captures variations in price momentum over a shorter duration, offering insights into the immediate price action.
Long-term RoC: This uses a longer period (longRoCLength) to provide a broader view of momentum, helping to smooth out short-term fluctuations and highlight more established trends.
Mid-term RoC: A weighted average of the short-term and long-term RoCs, the mid-term RoC (midRoCWeight) allows you to balance sensitivity and stability in the oscillator's behavior.
Weighted RoC Calculation:
The indicator calculates a single weighted average RoC by integrating short-term, long-term, and mid-term RoCs. The weighting factor can be adjusted to prioritize different market dynamics according to the trader’s strategy. This flexible approach enables the oscillator to remain applicable across diverse market conditions.
Oscillator Calculation and Smoothing:
The oscillator value is computed by subtracting a 14-period Weighted Moving Average (WMA) from the weighted RoC, which helps to normalize the oscillator, making it more responsive to changes in momentum.
The oscillator is then smoothed using a Simple Moving Average (SMA) over a user-defined period (smoothLength). This process reduces market noise, making the oscillator's signals clearer and easier to interpret.
Color-Coded Histogram:
The smoothed oscillator is displayed as a histogram, which is color-coded to reflect bullish or bearish momentum. You can customize the colors to match your charting style, with green typically representing upward momentum and red representing downward momentum.
The color-coded histogram allows for quick visual identification of momentum changes on the chart, aiding in your market analysis.
Zero-Line Reference:
A horizontal line at the zero level is plotted as a reference point. This zero-line helps in identifying when the histogram shifts from positive to negative or vice versa, which can be useful in understanding momentum shifts.
The zero-line offers a straightforward visual cue, making it easier to interpret the oscillator's signals in relation to market movements.
Customization and Versatility
The Dynamic RoC Oscillator with Histogram is designed with flexibility in mind, making it suitable for a wide range of trading styles, from short-term trading to longer-term analysis. Users have the ability to fine-tune the indicator’s input parameters to align with their specific needs:
Adjustable RoC Periods: Customize the short-term and long-term RoC lengths to match the timeframes you focus on.
Weighted Sensitivity: Adjust the mid-term RoC weight to emphasize different aspects of momentum according to your analysis approach.
Smoothing Options: Modify the smoothing moving average length to control the sensitivity of the oscillator, allowing you to balance responsiveness with noise reduction.
Use Cases
Momentum Analysis: Gain a clearer understanding of momentum changes within the market, which can aid in the evaluation of market trends.
Trend Analysis: The oscillator can help in assessing trends by highlighting when momentum is increasing or decreasing.
Chart Visualization: The color-coded histogram provides a visually intuitive method for monitoring momentum, helping you to more easily interpret market behavior.
Conclusion
The Dynamic Rate of Change (RoC) Oscillator with Color-Coded Histogram is a versatile and powerful tool for traders who seek a deeper analysis of market momentum. With its dynamic calculation methods and high degree of customization, this indicator can be tailored to suit a variety of trading strategies. By integrating it into your TradingView charts, you can enhance your technical analysis capabilities, gaining valuable insights into market momentum.
This indicator is easy to use and highly customizable, making it a valuable addition to any trader’s toolkit. Add it to your charts on the TradingView platform and start exploring its potential to enrich your market analysis.
Phát hành các Ghi chú
Changed the logic a bit to make it more trend following Phát hành các Ghi chú
...Phát hành các Ghi chú
...Phát hành các Ghi chú
added watermark in code Mã nguồn mở
Theo đúng tinh thần TradingView, tác giả của tập lệnh này đã công bố nó dưới dạng mã nguồn mở, để các nhà giao dịch có thể xem xét và xác minh chức năng. Chúc mừng tác giả! Mặc dù bạn có thể sử dụng miễn phí, hãy nhớ rằng việc công bố lại mã phải tuân theo Nội quy.
🚀 Elevate your edge with institutional-grade indicators & full trading systems.
🔗 Access tools: linktr.ee/0xKazo
🔗 Access tools: linktr.ee/0xKazo
Thông báo miễn trừ trách nhiệm
Thông tin và các ấn phẩm này không nhằm mục đích, và không cấu thành, lời khuyên hoặc khuyến nghị về tài chính, đầu tư, giao dịch hay các loại khác do TradingView cung cấp hoặc xác nhận. Đọc thêm tại Điều khoản Sử dụng.
Mã nguồn mở
Theo đúng tinh thần TradingView, tác giả của tập lệnh này đã công bố nó dưới dạng mã nguồn mở, để các nhà giao dịch có thể xem xét và xác minh chức năng. Chúc mừng tác giả! Mặc dù bạn có thể sử dụng miễn phí, hãy nhớ rằng việc công bố lại mã phải tuân theo Nội quy.
🚀 Elevate your edge with institutional-grade indicators & full trading systems.
🔗 Access tools: linktr.ee/0xKazo
🔗 Access tools: linktr.ee/0xKazo
Thông báo miễn trừ trách nhiệm
Thông tin và các ấn phẩm này không nhằm mục đích, và không cấu thành, lời khuyên hoặc khuyến nghị về tài chính, đầu tư, giao dịch hay các loại khác do TradingView cung cấp hoặc xác nhận. Đọc thêm tại Điều khoản Sử dụng.