PROTECTED SOURCE SCRIPT
Simple Mean Breach .v01

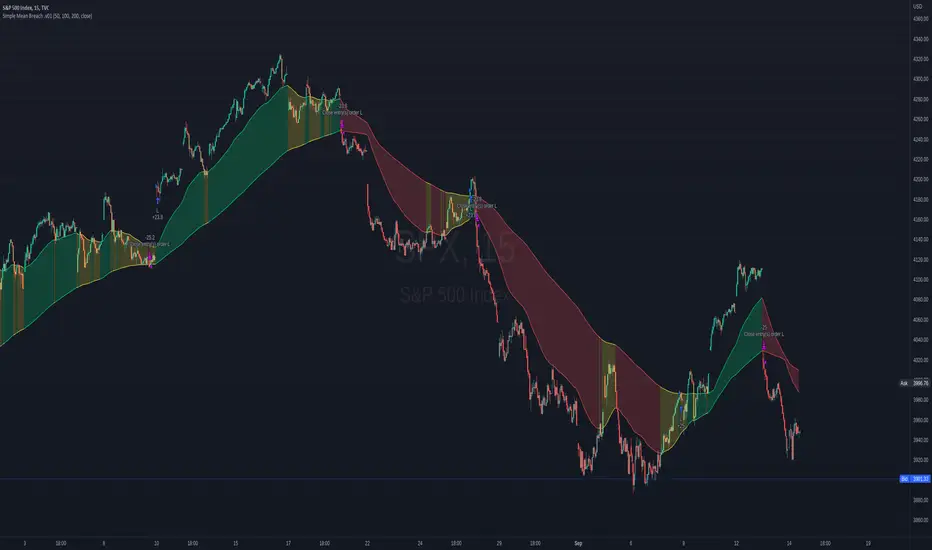
The script is based on moving averages, therefore the underbelly is no different from existing indicators. I've also borrowed ideas from existing scripts. However, this script is meant to help you automate your trading. I removed all the noise of multiple SMA lines, so it's easy to focus on what's important for entering or exiting the position; the top and bottom line at any point in time or price level.
Recommended use and markets:
You buy or sell when the price breaches the band. I would recommend focusing on one direction when using this indicator; I prefer going long. This works well with major indices (SPX, NDX, DJI) at 15m or 30m or even 10m, but not the crypto or individual stocks.
Notice that even when the S&P500 is in decline, you can still profit from the occasional powerful rally...if you stick to the script. This script is a visualisation that could help you take emotions out of your trading....you're welcome :)
Mã được bảo vệ
Tập lệnh này được đăng dưới dạng mã nguồn đóng. Tuy nhiên, bạn có thể sử dụng tự do và không giới hạn – tìm hiểu thêm tại đây.
Thông báo miễn trừ trách nhiệm
Thông tin và các ấn phẩm này không nhằm mục đích, và không cấu thành, lời khuyên hoặc khuyến nghị về tài chính, đầu tư, giao dịch hay các loại khác do TradingView cung cấp hoặc xác nhận. Đọc thêm tại Điều khoản Sử dụng.