OPEN-SOURCE SCRIPT
Cập nhật Divides company with Index
Overview:
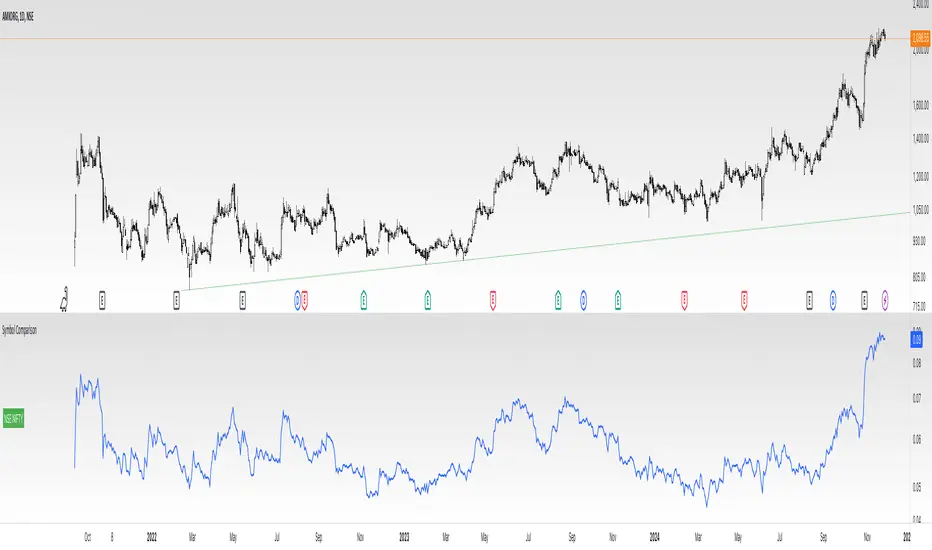
This indicator simplifies the comparison of a stock's performance against a specified index, such as the Nifty 50. By calculating and plotting the ratio between the two, it provides a clear visual representation of relative strength.
Key Features:
-Direct Comparison: Easily compare any stock against a selected index.
-Customizable Index: Choose from a dropdown menu or input a custom index symbol.
-Visual Clarity: Maximizing the chart provides a clear view of the relative performance.
-SMA Overlay: Add a Simple Moving Average (SMA) to identify trends and potential entry/exit
points.
-Customizable Appearance: Adjust background color, text color, and label size for personalized
visualization.
How to Use:
Add the Indicator: Add the indicator to your chart.
Select the Index: Choose the desired index from the dropdown menu or input a custom symbol.
Analyze the Ratio:
-A rising ratio indicates the stock is outperforming the index.
-A falling ratio suggests underperformance.
-The SMA can help identify potential trends and momentum.
Customize the Appearance: Adjust the background color, text color, and label size to suit your preferences.
Benefits:
-Improved Decision Making: Gain insights into a stock's relative strength.
-Faster Analysis: Quickly compare multiple stocks against a benchmark index.
-Enhanced Visualization: Customize the chart for better understanding.
-By leveraging this indicator, you can make informed trading decisions and gain a deeper
understanding of market dynamics.
Phát hành các Ghi chú
Updated chart.Overview:
This indicator simplifies the comparison of a stock's performance against a specified index, such as the Nifty50. By calculating and plotting the ratio between the two, it provides a clear visual representation of relative strength.
Key Features:
-Direct Comparison: Easily compare any stock against a selected index.
-Customizable Index: Choose from a dropdown menu or input a custom index symbol.
-Visual Clarity: Maximizing the chart provides a clear view of the relative performance.
-SMA Overlay: Add a Simple Moving Average (SMA)
-Customizable Appearance: Adjust background color, text color, and label size for personalized
visualization.
How to Use:
Add the Indicator: Add the indicator to your chart.
Select the Index: Choose the desired index from the dropdown menu or input a custom symbol.
Analyze the Ratio: A rising ratio indicates the stock is outperforming the index.
A falling ratio suggests underperformance.
The SMA can help identify potential trends and momentum.
Customize the Appearance: Adjust the background color, text color, and label size to suit your
preferences.
Benefits:
-Improved Decision Making: Gain insights into a stock's relative strength.
-Faster Analysis: Quickly compare multiple stocks against a benchmark index.
-Enhanced Visualization: Customize the chart for better understanding.
-By leveraging this indicator, you can make informed trading decisions and gain a deeper
understanding of market dynamics.
Phát hành các Ghi chú
Overview:This indicator simplifies the comparison of a stock's performance against a specified index, such as the Nifty 50. By calculating and plotting the ratio between the two, it provides a clear visual representation of relative strength.
Key Features:
-Direct Comparison: Easily compare any stock against a selected index.
-Customizable Index: Choose from a dropdown menu or input a custom index symbol.
-Visual Clarity: Maximizing the chart provides a clear view of the relative performance.
-SMA Overlay: Add a Simple Moving Average (SMA) to identify trends and potential entry/exit
points.
-Customizable Appearance: Adjust background color, text color, and label size for personalized
visualization.
How to Use:
Add the Indicator: Add the indicator to your chart.
Select the Index: Choose the desired index from the dropdown menu or input a custom symbol.
Analyze the Ratio:
-A rising ratio indicates the stock is outperforming the index.
-A falling ratio suggests underperformance.
-The SMA can help identify potential trends and momentum.
Customize the Appearance: Adjust the background color, text color, and label size to suit your preferences.
Benefits:
-Improved Decision Making: Gain insights into a stock's relative strength.
-Faster Analysis: Quickly compare multiple stocks against a benchmark index.
-Enhanced Visualization: Customize the chart for better understanding.
-By leveraging this indicator, you can make informed trading decisions and gain a deeper
understanding of market dynamics.
2 days ago
Release Notes
Updated chart.
Overview:
This indicator simplifies the comparison of a stock's performance against a specified index, such as the Nifty50. By calculating and plotting the ratio between the two, it provides a clear visual representation of relative strength.
Key Features:
-Direct Comparison: Easily compare any stock against a selected index.
-Customizable Index: Choose from a dropdown menu or input a custom index symbol.
-Visual Clarity: Maximizing the chart provides a clear view of the relative performance.
-SMA Overlay: Add a Simple Moving Average (SMA)
-Customizable Appearance: Adjust background color, text color, and label size for personalized
visualization.
How to Use:
Add the Indicator: Add the indicator to your chart.
Select the Index: Choose the desired index from the dropdown menu or input a custom symbol.
Analyze the Ratio: A rising ratio indicates the stock is outperforming the index.
A falling ratio suggests underperformance.
The SMA can help identify potential trends and momentum.
Customize the Appearance: Adjust the background color, text color, and label size to suit your
preferences.
Benefits:
-Improved Decision Making: Gain insights into a stock's relative strength.
-Faster Analysis: Quickly compare multiple stocks against a benchmark index.
-Enhanced Visualization: Customize the chart for better understanding.
-By leveraging this indicator, you can make informed trading decisions and gain a deeper
understanding of market dynamics.
Phát hành các Ghi chú
updated - few changes.1 - name will come at middle instead of top so that it is easy and wont disturb.
2 - can add custom symbol for denominator if you want.
Phát hành các Ghi chú
Key Improvement:The updated indicator now allows you to manually input a custom symbol for the first symbol, providing greater flexibility and precision in your analysis. This is particularly useful when dealing with symbols that might have the same name but belong to different countries or exchanges.
How to Use:
Input the Custom Symbol:
In the indicator's settings, you'll find an input field labeled "Custom Symbol."
Manually enter the desired symbol (e.g., NSE:APS) if you want to override the default symbol.
Select the Second Symbol:
Choose the second symbol (e.g., an index like "Nifty") from the dropdown menu.
Analyze the Ratio:
*The indicator will calculate and plot the ratio between the two symbols on the chart.
You can customize the chart's appearance and add technical indicators as needed.
Benefits of the Custom Symbol Feature:
*Precision: Ensures accurate calculations and analysis, especially for symbols with the same name but different exchanges.
*Flexibility: Allows you to compare any two symbols, regardless of their default settings.
*Enhanced Insights: Gain deeper insights into the relative performance of specific symbols.
By utilizing this feature, you can tailor the indicator to your specific needs and conduct more precise analysis.
Mã nguồn mở
Theo đúng tinh thần TradingView, tác giả của tập lệnh này đã công bố nó dưới dạng mã nguồn mở, để các nhà giao dịch có thể xem xét và xác minh chức năng. Chúc mừng tác giả! Mặc dù bạn có thể sử dụng miễn phí, hãy nhớ rằng việc công bố lại mã phải tuân theo Nội quy.
Thông báo miễn trừ trách nhiệm
Thông tin và các ấn phẩm này không nhằm mục đích, và không cấu thành, lời khuyên hoặc khuyến nghị về tài chính, đầu tư, giao dịch hay các loại khác do TradingView cung cấp hoặc xác nhận. Đọc thêm tại Điều khoản Sử dụng.