OPEN-SOURCE SCRIPT
Cập nhật Bond Yeild Curve
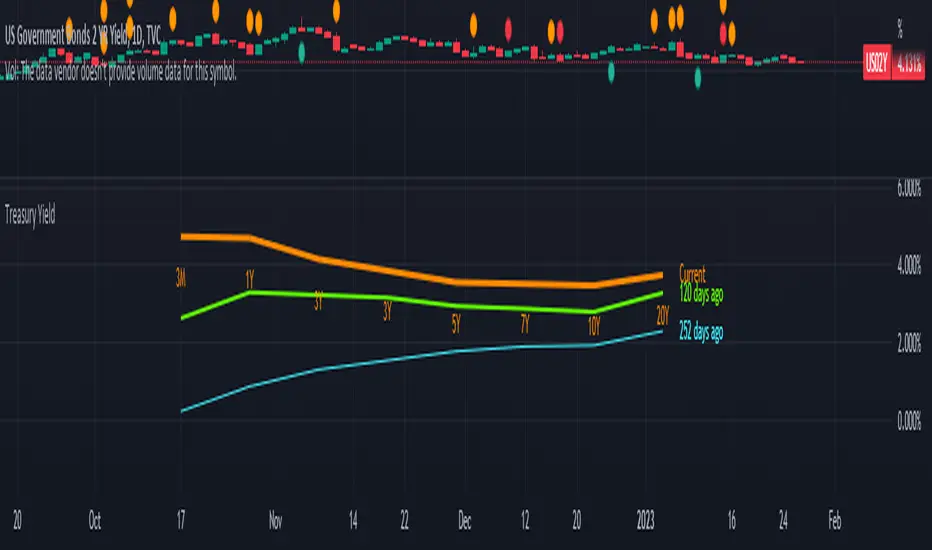
Bond Yeild Curve
A bond yeild curve is a line that plot the interest rate of bonds of each maturity dates.
The slope of the curve give the future of economy cycle.
if the slope could be normal (positive), flat or even inverted.
This indicator aquired data of bond yeild provided by TradingView.
How to use it.
How we can get the benefit.
- If the current spread is greater than 1.0, it suppose that the economy of that country probably is ok.
- if the current spread is between 0 - 1.0, it suppose to be flatted and probably turn to invert and the economy cound be in a recession soon.
- if the current spread is below 0, it suppose to be inverted and economy is in recession.
when knowing the state of economy, it would help us to manage our investment.
When you select "Yeild"

When you select "Spread"

When you select "Yeild Curve"

I'm new for this.
if any idea, correction and suggestion, i do appreciate it.
A bond yeild curve is a line that plot the interest rate of bonds of each maturity dates.
The slope of the curve give the future of economy cycle.
if the slope could be normal (positive), flat or even inverted.
This indicator aquired data of bond yeild provided by TradingView.
How to use it.
- Select the country of the bond / another country to compare.
- Select the maturity of bond (this indicator set 2Y, 5Y, 10Y and 20Y as default).
- You can toggle to 3 different data set; Yeild, Spread (10Y-2Y) and Yeild Curve.
- In case that you select the "Yeild Curve", you can customize the desired past period to compare.
How we can get the benefit.
- If the current spread is greater than 1.0, it suppose that the economy of that country probably is ok.
- if the current spread is between 0 - 1.0, it suppose to be flatted and probably turn to invert and the economy cound be in a recession soon.
- if the current spread is below 0, it suppose to be inverted and economy is in recession.
when knowing the state of economy, it would help us to manage our investment.
When you select "Yeild"
When you select "Spread"
When you select "Yeild Curve"
I'm new for this.
if any idea, correction and suggestion, i do appreciate it.
Phát hành các Ghi chú
Update. 1) Compare yield curve over period of time of treasury yield.
2) Compare yield curve between countries.
3) Show yield of each ttm in line chart.
Available TTM : 3M, 1Y, 2Y, 3Y, 5Y, 7Y, 10Y, 20Y
Some code i refer to this guy.
BarefootJoey :

Phát hành các Ghi chú
Minor fixed.Phát hành các Ghi chú
Update code and added 2-10 Spread. Mã nguồn mở
Theo đúng tinh thần TradingView, tác giả của tập lệnh này đã công bố nó dưới dạng mã nguồn mở, để các nhà giao dịch có thể xem xét và xác minh chức năng. Chúc mừng tác giả! Mặc dù bạn có thể sử dụng miễn phí, hãy nhớ rằng việc công bố lại mã phải tuân theo Nội quy.
Thông báo miễn trừ trách nhiệm
Thông tin và các ấn phẩm này không nhằm mục đích, và không cấu thành, lời khuyên hoặc khuyến nghị về tài chính, đầu tư, giao dịch hay các loại khác do TradingView cung cấp hoặc xác nhận. Đọc thêm tại Điều khoản Sử dụng.
Mã nguồn mở
Theo đúng tinh thần TradingView, tác giả của tập lệnh này đã công bố nó dưới dạng mã nguồn mở, để các nhà giao dịch có thể xem xét và xác minh chức năng. Chúc mừng tác giả! Mặc dù bạn có thể sử dụng miễn phí, hãy nhớ rằng việc công bố lại mã phải tuân theo Nội quy.
Thông báo miễn trừ trách nhiệm
Thông tin và các ấn phẩm này không nhằm mục đích, và không cấu thành, lời khuyên hoặc khuyến nghị về tài chính, đầu tư, giao dịch hay các loại khác do TradingView cung cấp hoặc xác nhận. Đọc thêm tại Điều khoản Sử dụng.